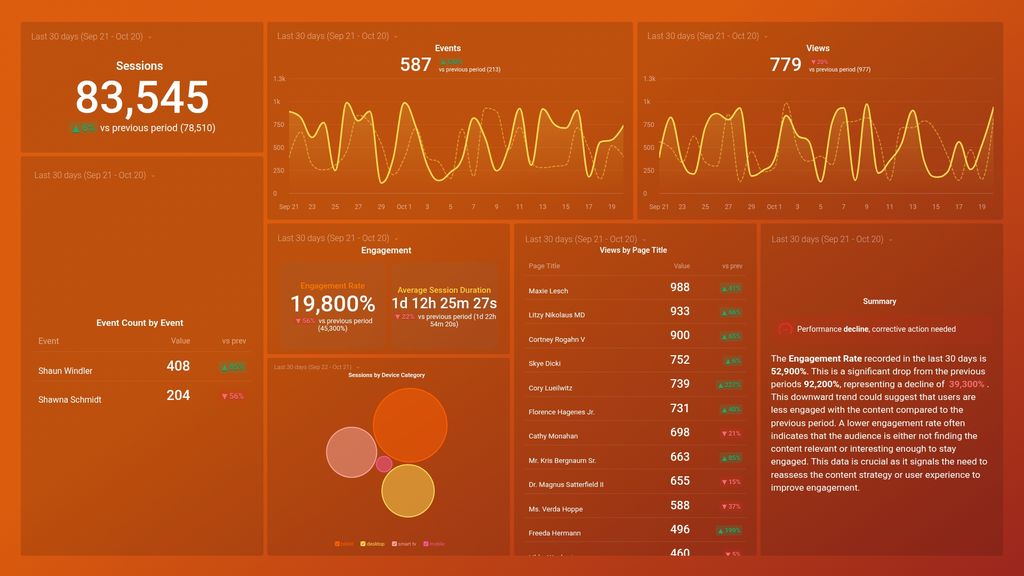
What you’ll learn from this Google Analytics 4 Engagement Overview Dashboard template:
By connecting your Google Analytics 4 account, you’ll learn:
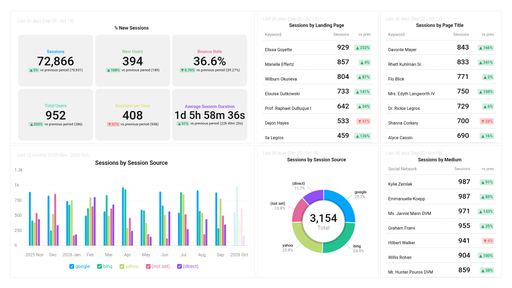
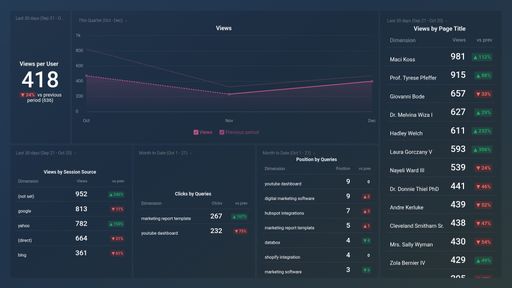
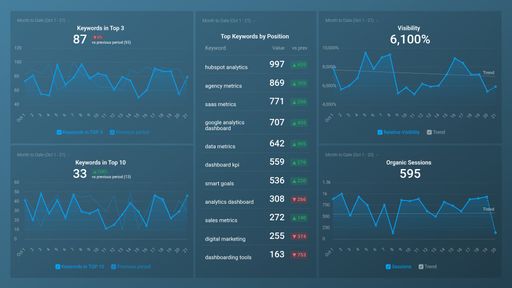
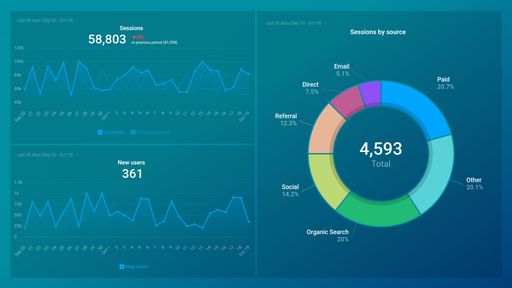
- How are the events and views trending on a daily/monthly/quarterly basis? Track the number of events and views you're getting on a regular basis. Compare that user engagement to previous periods to evaluate growth as well as your progress toward goals.
- Which pages do visitors view most? Identify the specific pages on your website users interact with the most and optimize these pages for conversions. Conversely, identify the pages people view least and make necessary adjustments.
- How much time do visitors spend on your website? Is your website content interesting to visitors? How many engaged sessions are you getting? Learn the number of page sessions, see the average engagement time spent on your site or app, and better understand how well your content engages them.
- Which events occur the most on your website and/or app? Learn the behavior of your users and measure the actions they're taking. Keep an eye on your engagement rate and track all the events in your users' journey. That way, the optimization of your website or app will be easier as you'll know which conversion events are lagging.
What else can you track and visualize with our deep integration with Google Analytics 4?
When it comes to attributing to your traffic and conversions, almost anything:
- Traffic and lead demographics
- Sales revenue
- Mapping out the customer journey
- Calculate average revenue per user/ARPU
- Website and app engagement
- Purchase paths of your users
- Landing page performance
- Monitor audience growth over time.
There are many, many different metrics and metric combinations you can track using Google Analytics 4. And in Databox, you can quickly visualize 100s of Google Analytics metrics in a variety of different ways. Read more about Databox’s Google Analytics 4 integration.