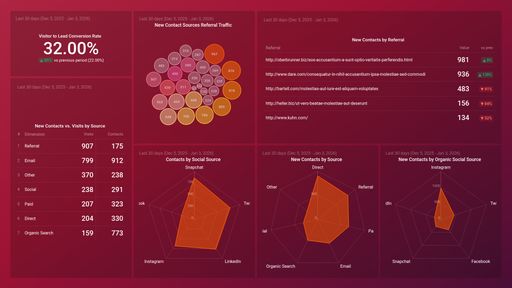
HubSpot Marketing + HubSpot CRM Performance Overview Dashboard Template

Template created by Databox Databox
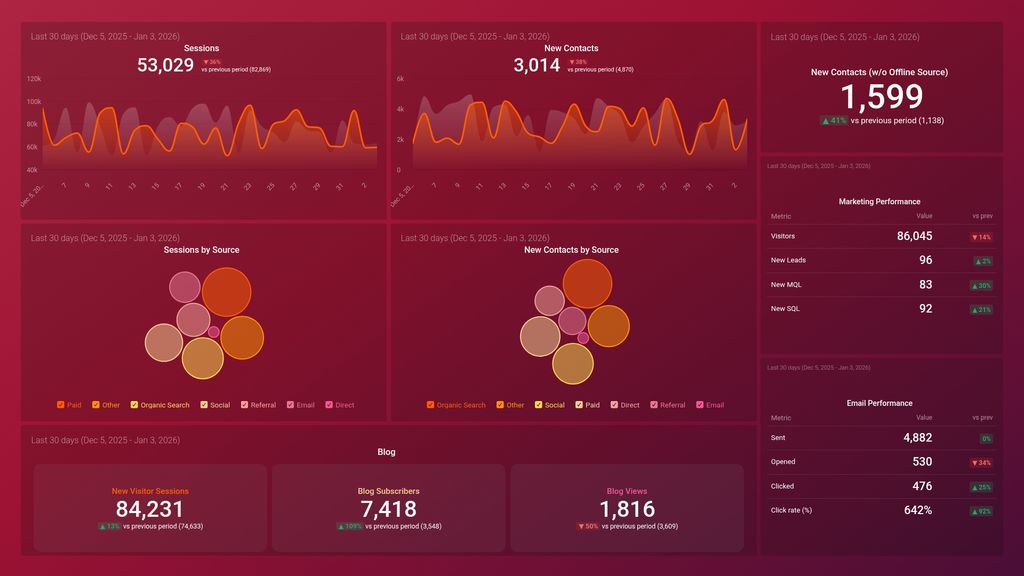
Download this HubSpot Marketing + HubSpot CRM Performance Overview Template to gain a complete insight into how your website is performing and converting.

Uses one-click integrations:

  • HubSpot Marketing HubSpot Marketing

If you don’t use HubSpot Marketing, you can pull data from any of our 100+ one-click, native integrations or from spreadsheets, databases and other APIs.

Get this dashboard for free

What you’ll learn from this HubSpot Marketing + HubSpot CRM Performance Overview Dashboard Template

Connect your HubSpot Marketing account and learn:

  • How do I measure the effectiveness of my marketing efforts? Measure the performance of your marketing campaigns, channels, and content pieces by tracking important Key Performance Indicators, such as the number of new customers, new opportunities, sales qualified leads, new contacts, average session duration, bounce rate, visitors, and sessions. By tracking the right marketing performance metrics, you’ll be able to measure your team’s performance against your set goals, determine if your current strategy for generating leads and converting them is working, or needs to be tweaked, and measure your marketing ROI.
  • How do I track the volume of visits to my website? Monitor the number of group interactions that take place on your website daily. Keeping an eye on your website sessions data lets you know if your marketing campaigns are driving visits to your website.
  • How many new contacts were created this month? See how many people interacted with your business within a specified time period and were recorded manually or automatically as new contacts. New contacts comprise of website visitors that filled a form, sent a chat, etc.

    Tracking this data is a great way to gauge the impact of your leads acquisition strategy.

  • How do I track new customers in Hubspot? View the total number of new customers your business has at any given time. Monitor this data daily in order to spot and act on unusual trends like a sudden drop in the number of new customers acquired.

    It is useful to track the total number of new customers you have in order to evaluate the impact of your current marketing strategies, create better-targeted marketing campaigns, and nurture relationships with your newly acquired customers.

  • Are my website visitors converting into leads? View and compare your session to contact conversion rate for the current time period with previous periods. Tracking this data is useful in order to gauge the effectiveness of your lead generation and nurturing campaigns.
  • How do I measure lead to customer conversion? See and compare your contact to customer conversion rate for the current time period with previous periods. Use this data to measure the effectiveness of your lead nurturing campaign.
  • Where do my website visitors and customers come from? See your top performing channels for driving visitors to your website, as well as the channels where your most qualified leads and customers come from.

Pull additional data using our deep integration with HubSpot Marketing

What else can you track and visualize with our deep integration with HubSpot Marketing? When it comes to traffic and conversions, almost anything:

  • Website traffic and conversions
  • Traffic and lead demographics
  • Landing page performance
  • The conversion rate(s) throughout your marketing and sales funnel(s)
  • Track and compare the efficiency of your marketing campaigns
  • Monitor campaign improvements and growth over time

There are numerous metrics and metric combinations you can track using HubSpot Marketing. In Databox, you can quickly visualize 100s of HubSpot metrics in various ways.

Read more about Databox’s HubSpot Marketing integration.

HubSpot Marketing HubSpot Marketing metrics included in this template
  • Bounce Rate

    Bounce Rate is a metric that measures the percentage of website visitors who leave a site after only viewing one page. It indicates the effectiveness of a website in engaging visitors and driving conversions.

  • Became an Opportuinty

  • Sessions by Source

    Sessions by Source is a metric in Hubspot that shows the number of website sessions generated by different traffic sources, such as organic search, paid search, social media, email marketing, and direct traffic.

Customize dashboard
Explore all of Databox’s functionalities:

Customize this dashboard with Databox

Sometimes, you’ll want to dive deeper into performance. When you need to customize this template (or any other dashboard) to include different metrics, add metrics from different sources, etc., you can do so by using Databox’s Dashboard Designer.

The Designer allows you to easily drag-and-drop metrics and visualizations from any data source right into your dashboard.

Get Started