Uses one-click integrations:
-
 HubSpot Marketing
If you don't use HubSpot Marketing, you can pull data from any of our 130+ one-click, native integrations or from spreadsheets, databases and other APIs.
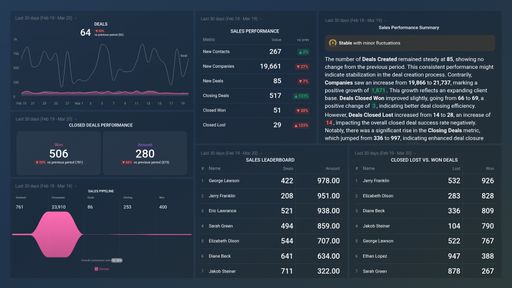
Try this dashboard for freeWhat does your marketing funnel look like?
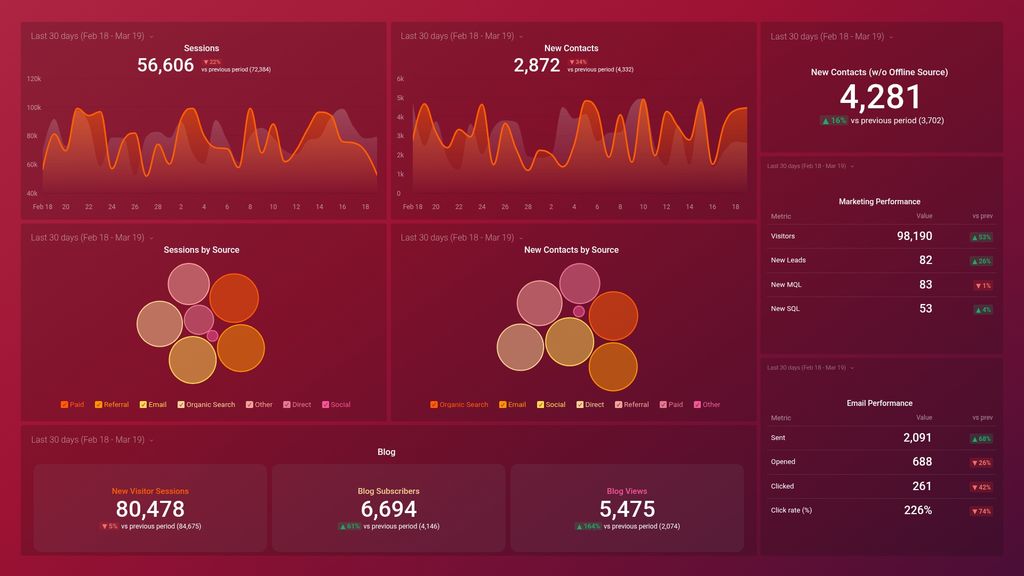
Instant snapshot of over 140 key marketing metrics
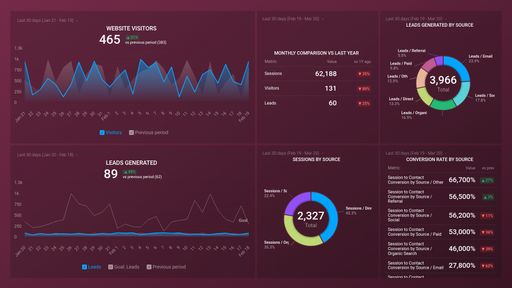
- Get a live funnel with visitors, leads, MQLs, SQLs and more
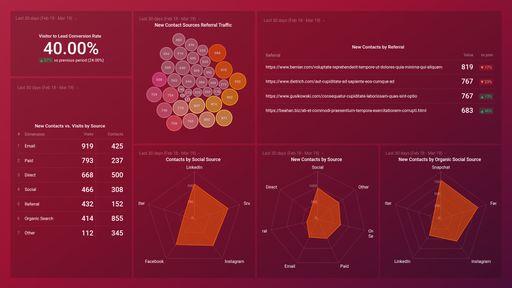
- See the most successful sources of traffic
- Compare this month’s activity to last month
- Highlight specific channels that are overachieving
Key Metrics
- Sources of Site Traffic
- Email Clicks and Opens
- Conversion Rates throughout Funnel
- Daily Traffic
- Traffic Amounts, by Source