AccuRanker (Keyword Overview) Dashboard Template

Template created by Databox Databox
Use this free, easy-to-understand AccuRanker (Keyword Overview) Dashboard Template to monitor changes in your keyword ranking positions daily and over time. Learn how your most important keywords are performing in organic search by tracking useful metrics such as CPC, search volume, share of voice, rank, and so on.

Uses one-click integrations:

  • AccuRanker AccuRanker

If you don’t use AccuRanker, you can pull data from any of our 70+ one-click, native integrations or from spreadsheets, databases and other APIs.
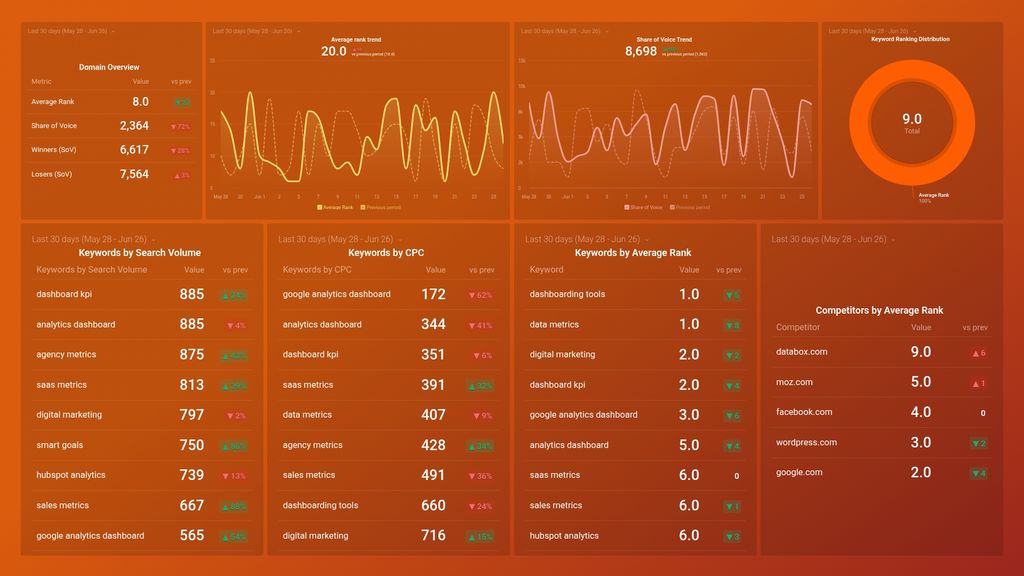
Get this dashboard for free

What you’ll learn from this AccuRanker (Keyword Overview) Dashboard Template:

  • How are my most important keywords performing? Track and assess your brand’s performance in organic search results for your most important keywords in real-time. Keep an eye on this metric to find out whenever your target keywords with high traffic decline in rank.
  • Which keywords does my website rank for? Find out how well your website ranks for your most important keywords at any point in time. Also, monitor changes in your keyword rankings on a daily, weekly, and monthly basis.
  • How do I find monthly search volume for my target keywords? View the average number of searches made on any search engine for your most important keywords in a month.
  • Which keyword has the highest cost-per-click? Find out how much advertisers pay for a single click for your specified keywords. It is beneficial to track your keyword CPC as it is a good measure of your target keywords’ profitability and competitiveness.

Pull additional data using our AccuRanker integration

What other campaign metrics can you track and visualize with AccuRanker?

  • Competitor rankings
  • Keyword rankings
  • Domain authority
  • Landing page(s) performance
  • Landing page performance
  • Competitor intelligence and more

There are many different metrics and metric combinations you can track using these integrations. And in Databox, you can quickly visualize dozens of AccuRanker metrics in a variety of different ways.

AccuRanker AccuRanker metrics included in this template
  • Keywords by Average Rank

    The average Rank for all your Keywords during the specified Date Range split up by Keywords. Average Rank only takes into consideration the Keywords with Rankings, however for most Users there will always be Keywords "not in 500". The current day's data is not included in this metric value for any Date Range. Yesterday's data is the most recent data returned from AccuRanker's API. No historical data is available from before the initial connection.

  • Keywords by CPC

    Average Cost per Click (AdWords) for the given Keywords. The current day's data is not included in this metric value for any Date Range. Yesterday's data is the most recent data returned from AccuRanker's API. No historical data is available from before the initial connection.

  • Keywords by Search Volume

    Average monthly Search Volume during the specified Date Range split up by Keywords. No historical data is available from before the initial connection. The current day's data is not included in this metric value for any Date Range. Yesterday's data is the most recent data returned from AccuRanker's API. No historical data is available from before the initial connection.

  • Keywords by Share of Voice

    Share of Voice is an indicator of how your most important Keywords are performing during the specified Date Range split up by Keywords. All keywords that Rank between positions 1 to 20 are used for the calculation. The current day's data is not included in this metric value for any Date Range. Yesterday's data is the most recent data returned from AccuRanker's API. No historical data is available from before the initial connection.

Customize dashboard
Explore all of Databox’s functionalities:

Customize this dashboard with Databox

Sometimes, you’ll want to dive deeper into performance. When you need to customize this template (or any other dashboard) to include different metrics, add metrics from different sources, etc., you can do so by using Databox’s Dashboard Designer.

The Designer allows you to easily drag-and-drop metrics and visualizations from any data source right into your dashboard.

Get Started