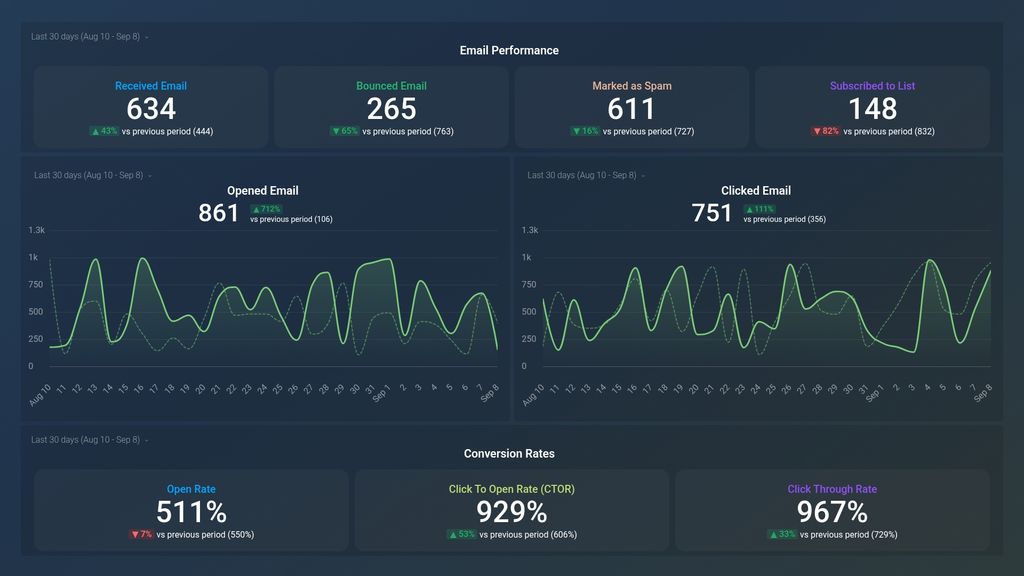
What you’ll learn from this Klaviyo Email Performance Dashboard Template:
Connect your Klaviyo account and learn:
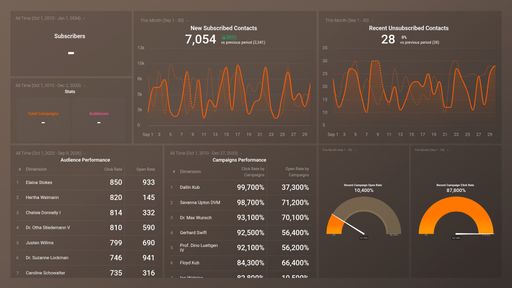
- How many times did my contacts open my sent email? See how many times your email recipients opened your sent email within a given time frame. Track your opened email data on a daily basis, if people are not opening your emails, it is a sign you need to improve certain email elements, e.g subject lines, time for sending emails, etc.
- How many times did the link(s) in my sent email get clicked? Track the total number of times that at least one link in your sent email was clicked by its recipients. Track your clicked email data on a daily basis and compare the number of clicks recorded in your latest email campaign to the number of clicks recorded in your previous email campaign? Is there a significant difference? If yes, find out why.
- What percentage of my subscribers opened my recently sent email? Find out what percentage of your email recipients opened your sent emails after successfully receiving them within a period of time.
- What percentage of my email recipients clicked on the link(s) in my sent email? Find out what percentage of your email recipients clicked on at least one link in your sent email. A high click-through rate is a good indication that your email is clear, consistent, and compelling.
- How do I track email bounces? See the total number of emails that did not get delivered to their intended mailing addresses, and were returned back to you for one reason or another. It is crucial to monitor your bounced emails regularly and also remove these email addresses in order to keep your email list up-to-date and to avoid negatively impacting your email deliverability rate.
- How do I measure the performance and relevance of my email campaigns? Track the percentage of subscribers who clicked on at least one link in your email in comparison to the total number of recipients who opened your email.
- Are my emails going to spam? View how many of your emails were blocked or flagged as spam by your recipients’ spam filters within a specific time period.
Pull additional data using our deep integration with Klaviyo.
What else can you track and visualize with our deep integration with Klaviyo? When it comes to tracking and assessing your most important email engagement metrics, almost anything:
- Campaign performance
- Subscribe and unsubscribe rates
- Top email recipients
- Open and Click-through rates by campaign
There are many, many different metrics and metric combinations you can track using Klaviyo. And in Databox, you can quickly visualize dozens of email marketing metrics in a variety of different ways.
Explore more Klaviyo dashboards.