Uses one-click integrations:
-
 LinkedIn Ads
If you don't use LinkedIn Ads, you can pull data from any of our 130+ one-click, native integrations or from spreadsheets, databases and other APIs.
Try this dashboard for free
LinkedIn Ads metrics included in this template
-
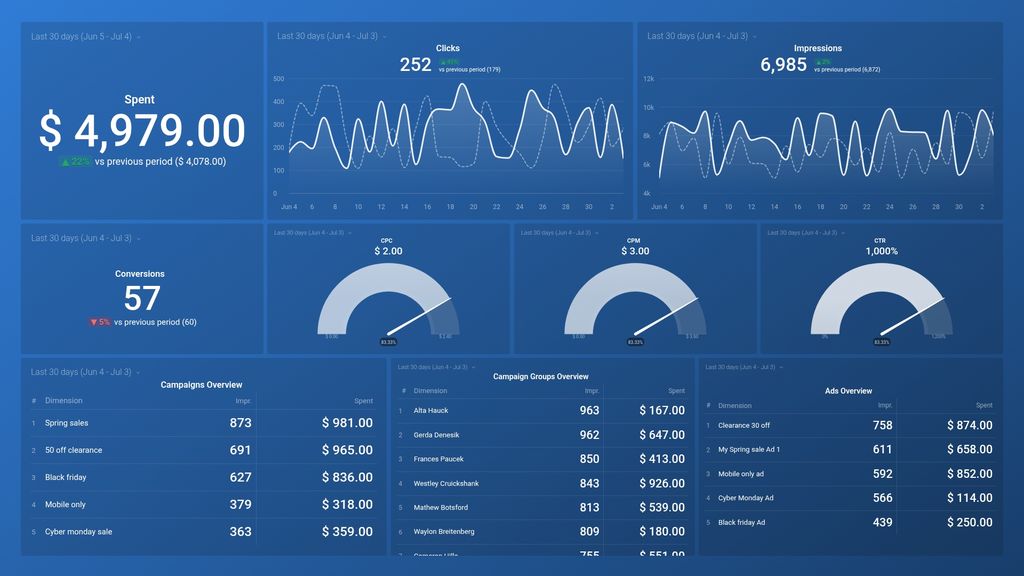
Clicks
The Clicks metric represents the total number of clicks on your ad, including clicks on links, buttons, and other interactive elements within the ad.
-
Conversions
Conversions is a metric that measures the number of times a desired action is completed on a LinkedInAds campaign, such as filling out a form or making a purchase. It helps advertisers track the effectiveness of their ad campaigns in driving valuable actions.
-
Impressions
Impressions is a metric that measures the total number of times your ad was shown to LinkedIn users, regardless of whether they clicked on it or not.
-
Spent
Spent is a metric that indicates how much money has been paid for LinkedIn Ads campaign or set of campaigns. It is the total amount of your advertising spend during a specific time period.
-
Average CPC
Average CPC is the average cost per click for your LinkedIn Ads campaign. It is calculated by dividing the total cost of the campaign by the number of clicks received.
-
Average CPM
Average CPM (Cost Per Thousand Impressions) is the average cost that an advertiser pays for a thousand ad impressions on LinkedIn.
-
Average CTR
The Average CTR (Click-Through Rate) measures the percentage of impressions that result in clicks on a LinkedIn ad. It's a key performance indicator (KPI) that helps gauge ad effectiveness. A higher CTR indicates that more people are interested in the ad, leading to better engagement and potentially higher conversion rates.
-
Impressions by Campaign
Impressions by Campaign is a metric used to track the total number of times an ad from a specific campaign has been displayed to users on LinkedIn. It measures overall reach and can provide insight into ad effectiveness.
-
Impressions by Campaign Group
Impressions by Campaign Group is a metric that shows the total number of times ads from a particular campaign group were displayed to LinkedIn users, regardless of whether they clicked on them or not. It helps measure the reach of the ads and their potential impact on the target audience.
-
Impressions by Ad
Impressions by Ad metric refers to the total number of times LinkedIn users have viewed an ad. It is a measure of the ad's visibility and reach on the platform, indicating how many times the ad has been shown to potential customers.
-
Spent by Campaign
Spent by Campaign is a metric in LinkedIn Ads that shows the total cost spent on a specific advertising campaign during a specified time period.
-
Spent by Campaign Group
The Spent by Campaign Group metric shows the total amount of money spent on multiple campaigns within a single campaign group.
-
Spent by Ad
Spent by Ad is a metric in LinkedInAds that calculates the total amount of money spent on a specific ad campaign during a specified time period. It helps to track and manage ad expenses more efficiently.