What you’ll learn from this Google Analytics 4 KPI Dashboard Template:
By connecting your Google Analytics 4 account, you’ll learn the following:
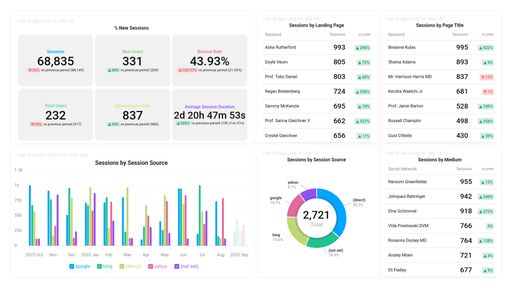
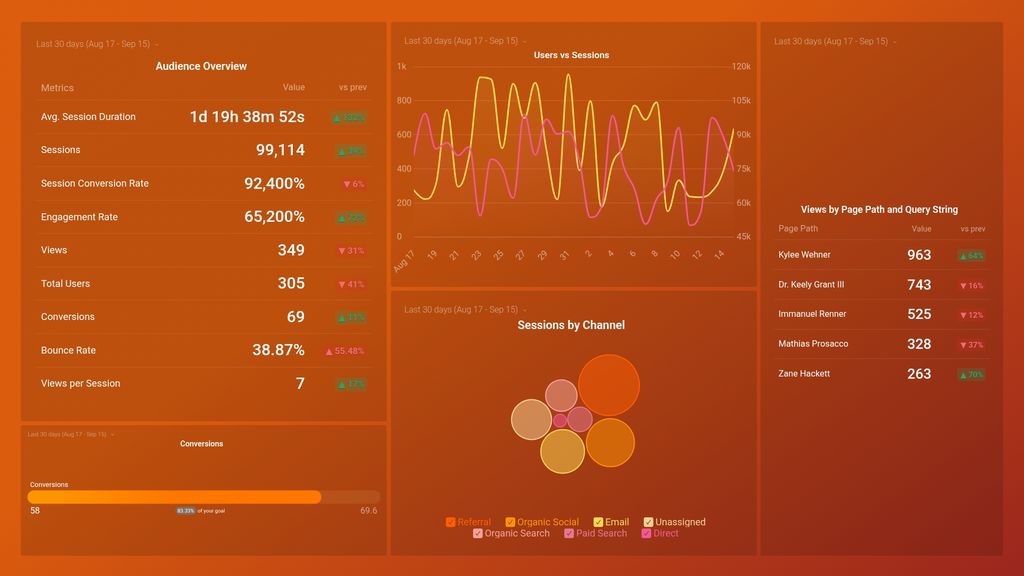
- How engaged is your audience? Is your website content interesting to visitors? How many engaged sessions are you getting? Learn about your bounce rate, average session duration, and the percentage of new users. This will give you an overall insight into how your website is performing.
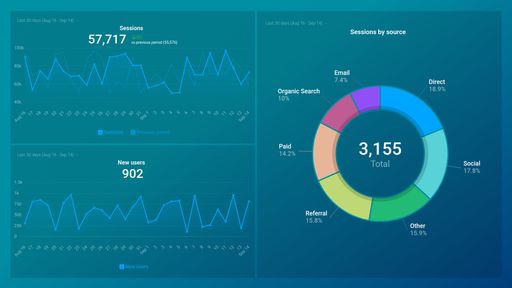
- Are your sessions trending up or down? Track the number of sessions vs the number of users on your website during a specific time frame. By comparing this number to previous periods, you can gain more insights and take appropriate steps to ensure that it continues to go up rather than stagnate or decline.
- Which channels bring in the most sessions? Identify the specific channels that bring in the most users to your website. This will help you focus your efforts where you are most likely to see an ROI when it comes to increasing the number of users. Whether it is upping your Facebook Ads budget or investing more in your Email campaigns.
- Are you on the trajectory to hit your conversion goal? Keep track of your conversions and see how close you are to reaching your pre-set goal. By doing this in real time you can adjust your strategy on the go and increase your chances to stay on the upwards trajectory.
What else can you track and visualize with our deep integration with Google Analytics 4?
When it comes to attributing to your traffic and conversions, almost anything:
- Website Engagement
- Sales revenue
- Mapping out the customer journey
- Calculate average revenue per user/ARPU
- Website and app engagement
- Purchase paths of your users
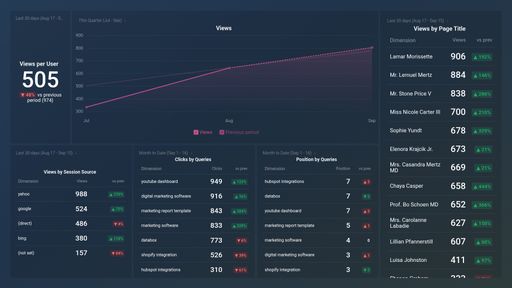
- Landing page performance
- Monitor audience growth over time.
There are many, many different metrics and metric combinations you can track using Google Analytics 4. And in Databox, you can quickly visualize 100s of Google Analytics metrics in a variety of different ways. Read more about Databox’s Google Analytics 4 integration.