With Databox, anyone can build custom dashboards
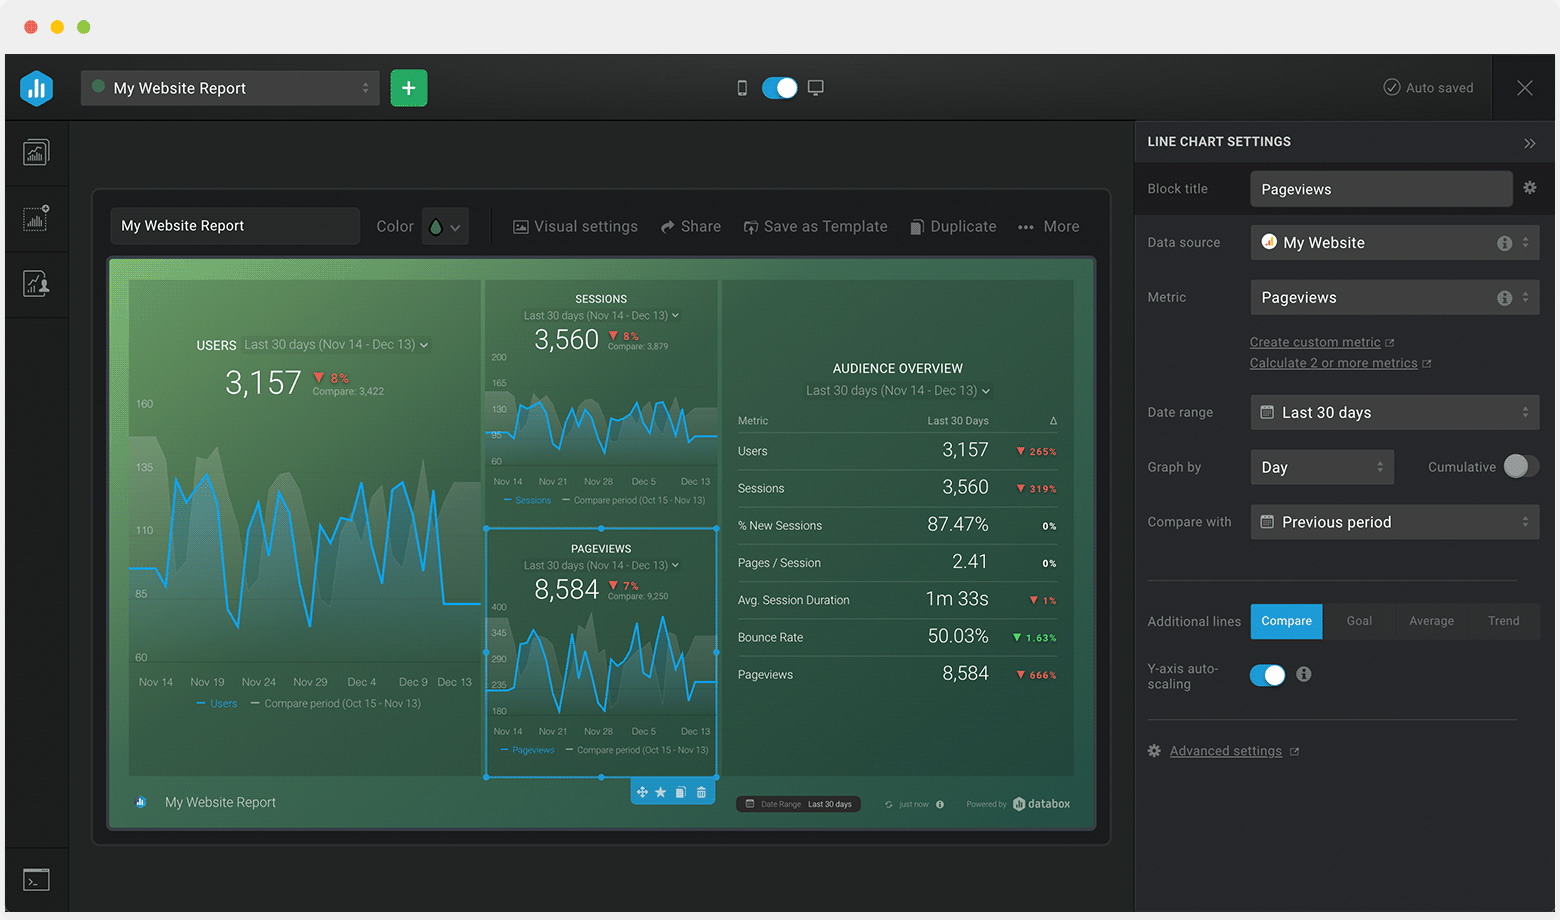
No more fumbling around trying to visualize data in spreadsheets or slides. With our DIY Dashboard Designer, anyone can pull the metrics they need, visualize KPIs in a variety of ways, and build meaningful dashboards–no code or design skills necessary.

Create a meaningful business dashboard in minutes
With our dashboard design wizard, building a dashboard in Databox is as simple as connecting a data source and choosing the specific metrics you need from a list of the most popular metrics from 130+ data sources. Then, your data populates in seconds without any design or code needed.

Edit any of our 200+ dashboard templates using the Dashboard Designer
You might want to design your own dashboards, but that doesn’t mean you have to start from scratch. You can start with any of our 200+ dashboard templates and customize them however you want inside the Dashboard Designer. Add new metrics, delete ones you don’t want, resize the blocks, change the visualization type, add goals, and more.

Track performance from multiple sources in one dashboard
Need to track performance from various sources in one dashboard? Maybe you want to track marketing performance from Google Analytics with sales performance from HubSpot CRM in order to connect the dots between marketing and sales. With the Designer, you can easily toggle between all of your connected sources and pull any of the pre-built metrics or visualizations into your dashboard as needed.

Compare current performance to goals, past performance, and more
Need to see how performance is trending toward your goals? Or how this month’s sales performance compares to last month’s or last quarter’s? Use the Datablock Editor to select customizations and measure any metric in your dashboard against the goals you’ve set in Databox, previous performance, and more.

Customize your dashboard using simple drag-and-drop functionality
Creating reports from scratch can be intimidating. Which metrics should you track? How should you visualize them? We took care of this for you. We’ve created pre-built visualizations of the most popular metrics associated with any of our 130+ data sources. This means all you need to do is drag-and-drop the ones you need into your dashboard and they will populate with your data and visualization automatically.

Rearrange metrics on your dashboards with ease
Customizing the way your data is presented on your dashboard is as simple as selecting any Datablock to resize it and/or move it around to make room for other visualizations. Databoards are dynamic, so anytime you move or resize a Datablock, the rest of your dashboard will adjust automatically.

Design company dashboards with your color scheme and logos
Want to make beautiful Dashboards that represent your brand? With Databox, we’ve designed Databoards so they always look professional and so your data is always easy to interpret. You can also pick a color scheme that matches your brand and even add your own logo or graphics to a Databoard. You may even consider our white label add-on to completely rebrand Databox as your own software.
How to Build Dashboards in Databox
Create a new dashboard
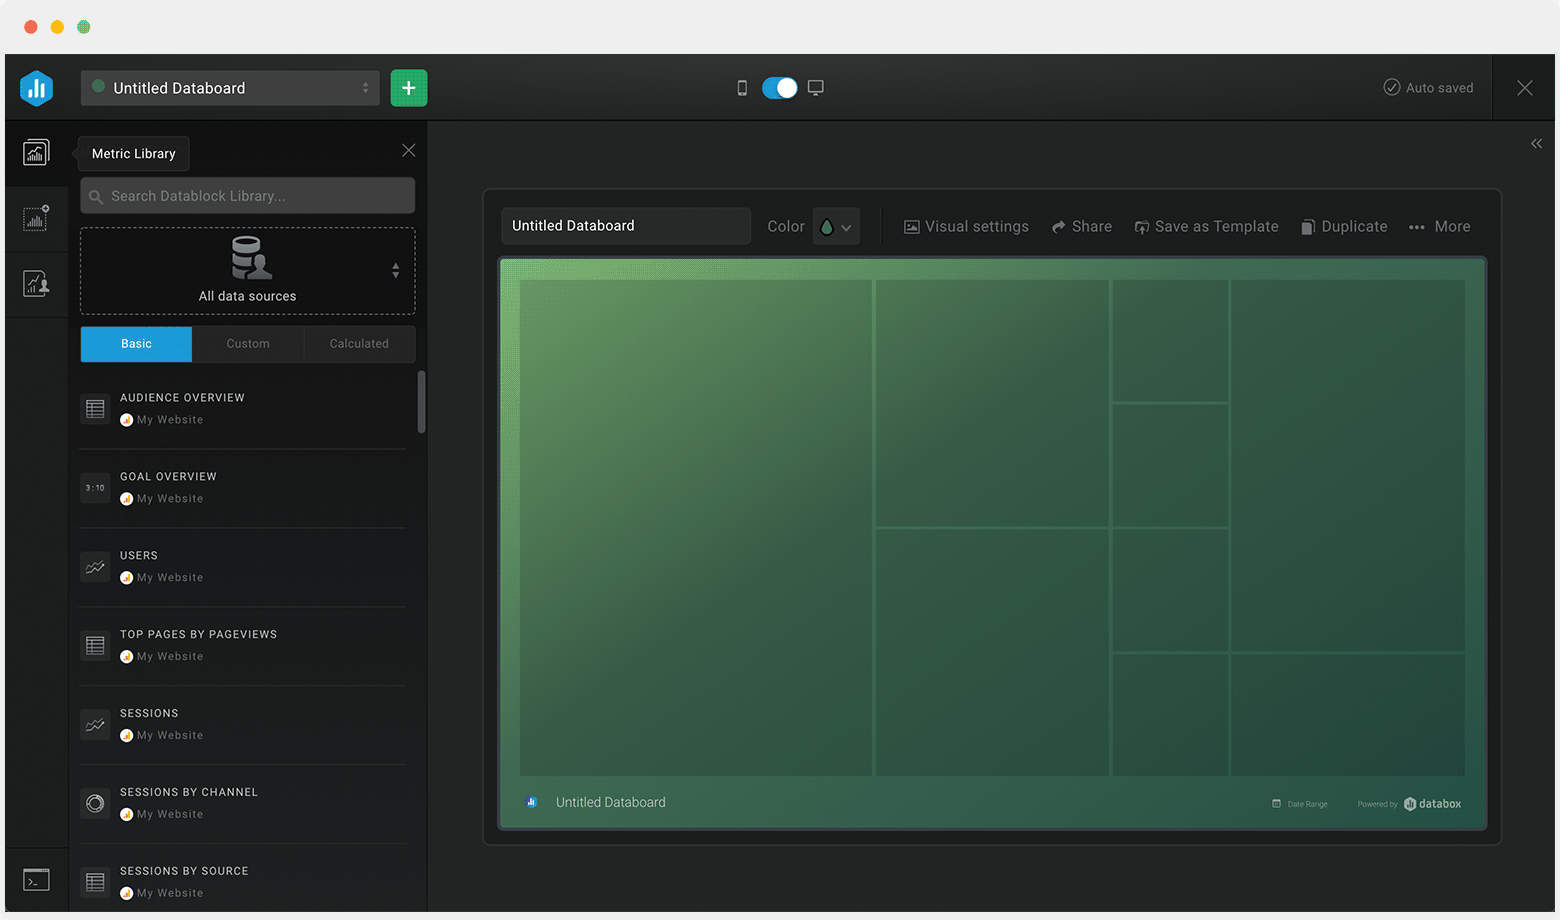
Name your dashboard
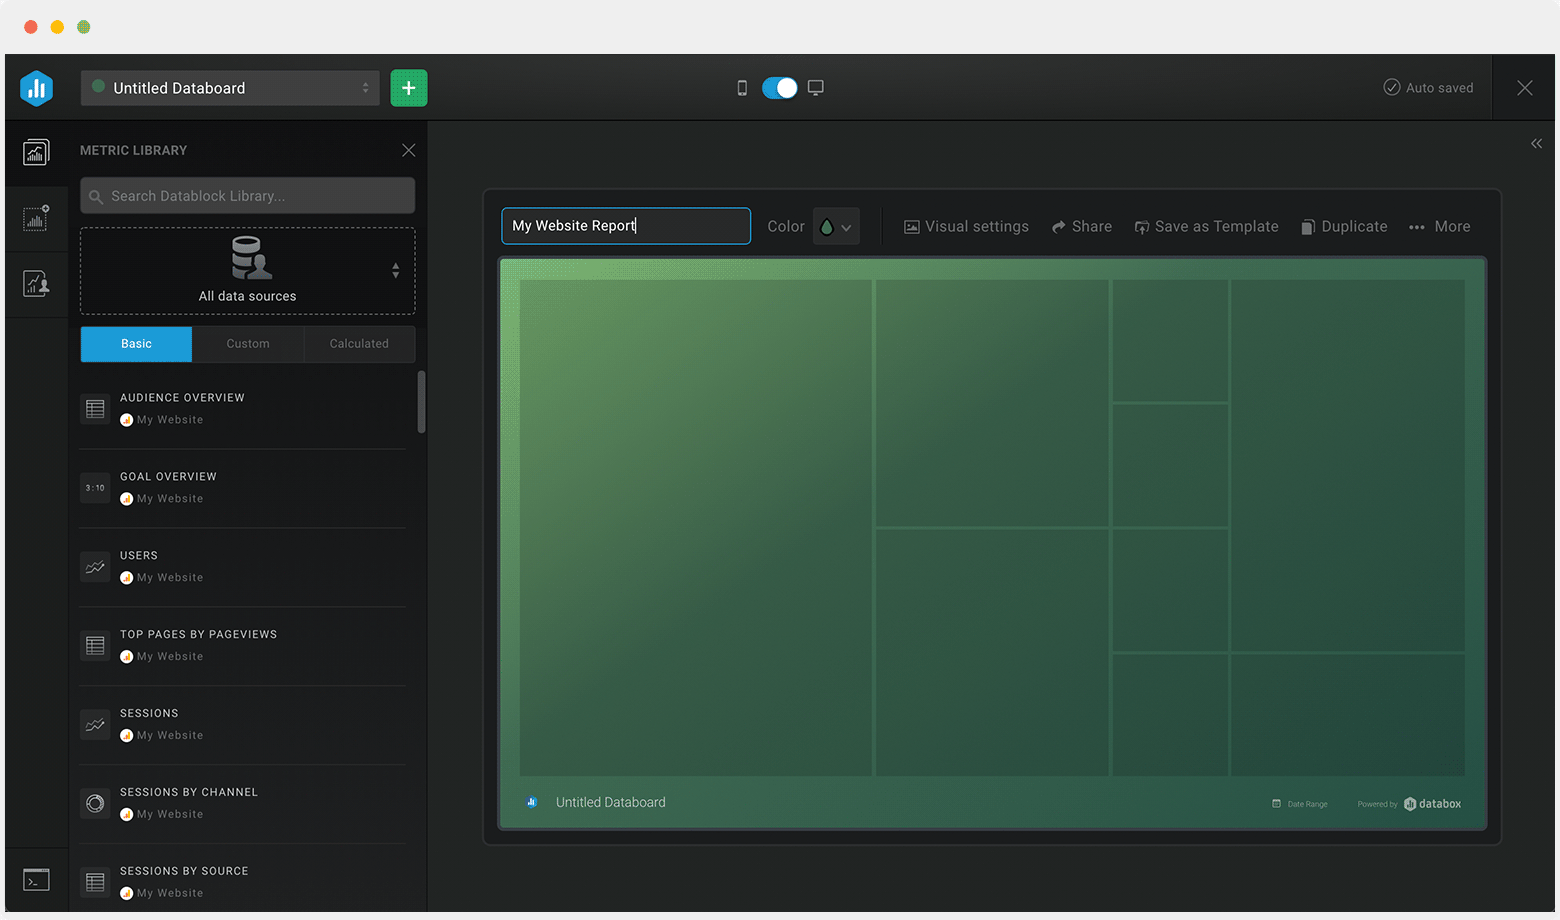
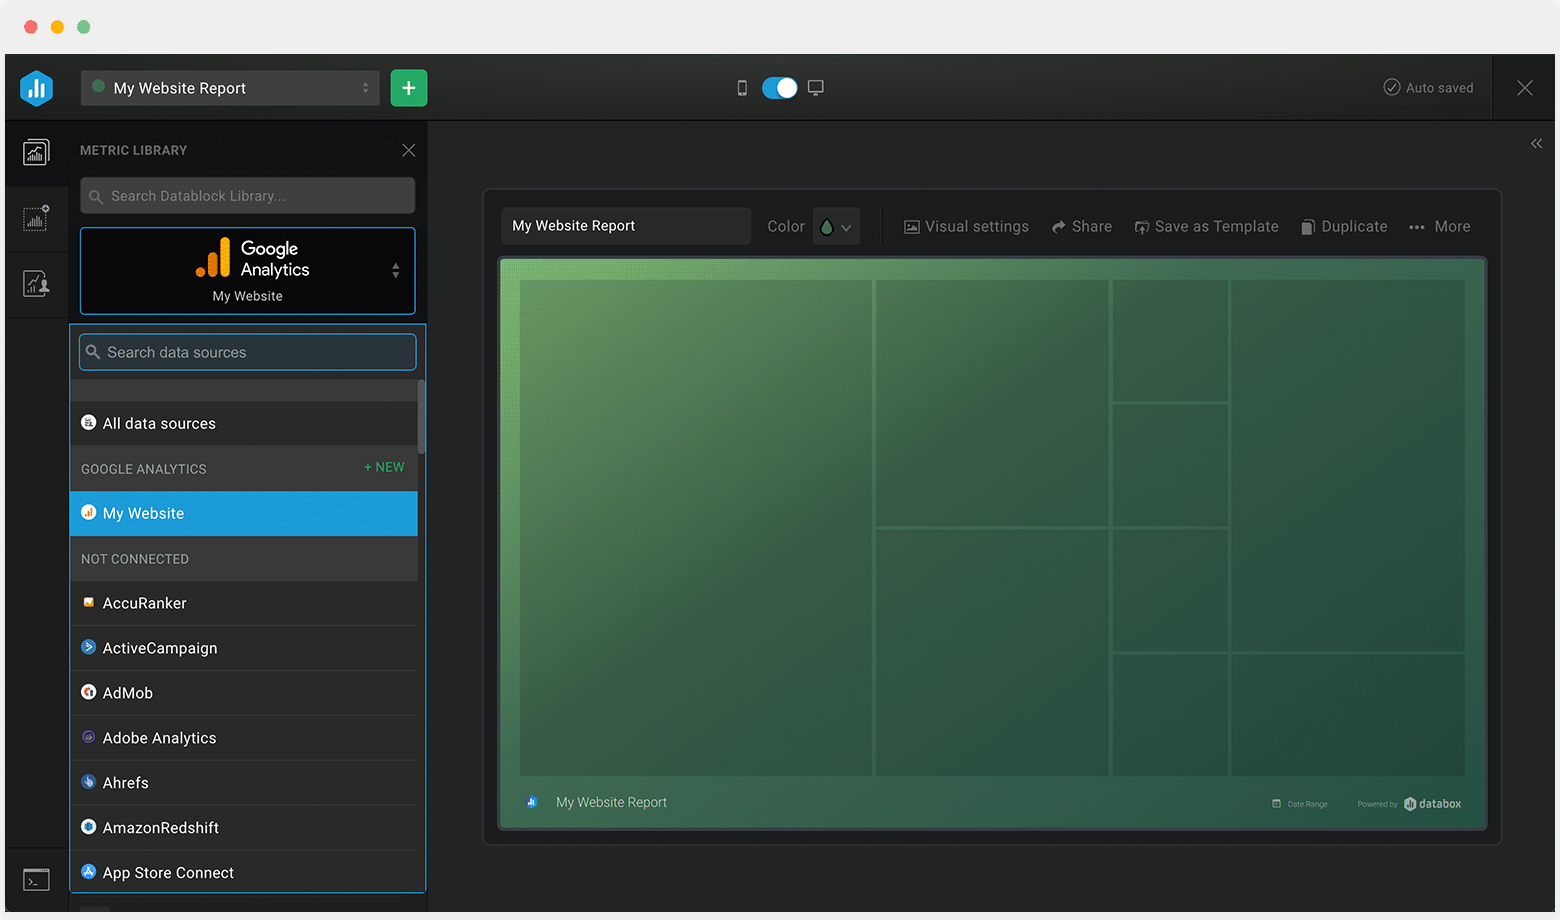
Select a data source
Drag-and-drop pre-built metrics from that source to your dashboard
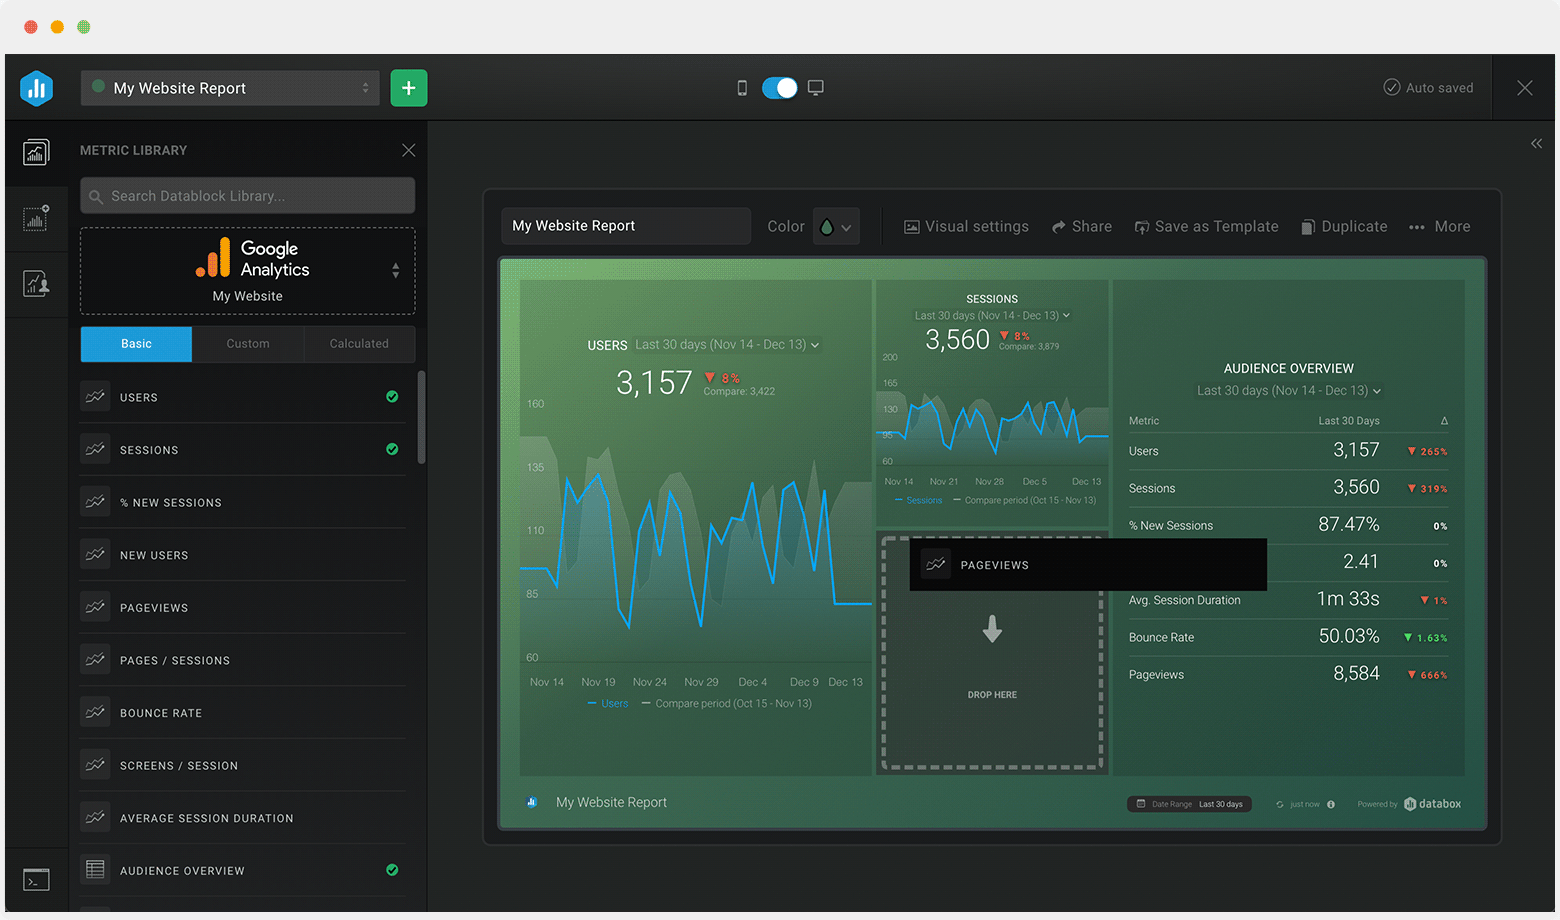
Customize each metric block

“The Dashboard Designer has provided our team and clients the flexibility and efficiency to build custom dashboards whenever necessary. It’s amazing how easy it is to pull data and top KPIs from multiple data sources into one screen. It’s hard to imagine our team ever going back to building reports manually.”
Steve James, Partner at Stream CreativeBuild custom dashboards in minutes
Connect your data, select your metrics and start tracking your performance in minutes.
Get Databox FreeDashboard Designer FAQs
Yes. With our Dashboard Designer, you’re able to create or even edit existing dashboards in Databox. You can either start blank or use the setup wizard—a menu that allows you to select the metrics you want and with a click of a button, the visualizations will populate. Here’s more on how you can create a dashboard.
Yes. In fact, we recommend doing so for a comprehensive view of performance. Inside the Designer, you can swap through different data sources you’ve connected and pull whatever metrics you need right into your dashboard. Here’s how you can create a dashboard using data from multiple data sources.
First, you need to create a client account. Then, there are a couple of ways you can create a client dashboard. You can…
- Create an Account Template, complete with the data sources, metrics, and visualizations that you need, and save them to your account so that they can be duplicated for any client in just one click.
- Switch easily between client accounts and create new dashboards directly in each client account.
Yes, you can set your logo and brand colors of your dashboards. Even better, you can build a completely branded experience with fully branded dashboards, email alerts, a custom subdomain, and even a mobile experience with just a few clicks with Databox’s White-labeling add-on.
All plans offer an unlimited number of dashboards. Learn more about our plans and packaging here.
Yes. You can set dashboard permissions and decide who can create, edit, and view your dashboards.
Yes, they’re called Account Templates. There’s no limitation on how many of them you can create and you can re-use them in your own account, or in your client accounts.
Yes. We have a native integration with Google Sheets, so you can connect your Google Spreadsheet with just a few clicks. The Google Sheet integration is available on our Performer and Professional plans. Learn more by reading this guide on Using Google Sheets with Databox.
Yes, SQL integrations are available on Performer and Professional plans. We currently have native integrations with PostgreSQL, MySQL and Microsoft SQL Server.
Yes. To create and showcase a centralized report, you’re able to loop multiple dashboards together. They’ll be joined together on one Shareable link that you can then share with your team and/or clients.
There are a couple of options. You can…
- Use a Shareable Link. By using the Shareable Link, you’ll ensure everyone has one central location to access the appropriate reports with the same date ranges, visualizations, and data sync frequency as you have set.
- Share PDFs or JPGs of your dashboards with your team by using Scheduled Snapshots. You just need to schedule them once and they’ll send at the same time of your choosing every day, week, or month.
- Send your data to any public Slack channel. This way, everyone on your team is aware of how the key metrics your business cares about are trending without having to dig around for them or distract other team members to find them.
- Stream Dashboards to a TV. You can stream your dashboards to any TV simply by visiting tv.databox.com and entering your unique streaming code.
- Embed your dashboards on a webpage and share live, interactive dashboards with your website visitors.
You can stream your dashboards to any TV by visiting tv.databox.com and entering your unique streaming code, see how to do it here.
Yes, using our Databox mobile app for iOS and Android. And, you can receive your daily scorecards, weekly summaries, and performance alerts directly to your mobile phone.
Yes. We offer Services around helping you set up and automate your dashboard reporting. Start a chat or send us an email at help@databox.com and we’ll help you get set up.
We have an extensive Dashboard Template Gallery. These come pre-built, so all you have to do is connect the appropriate data source and all your data and visualizations will load in seconds.


