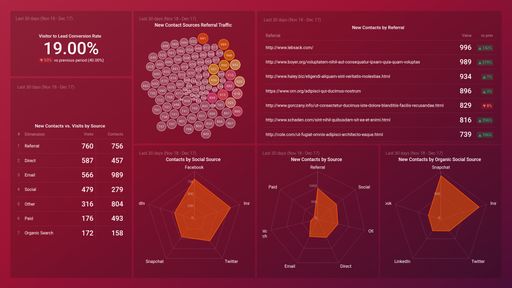
HubSpot Inbound Marketing Performance Dashboard Template

Template created by IDS Growth Agency IDS Growth Agency
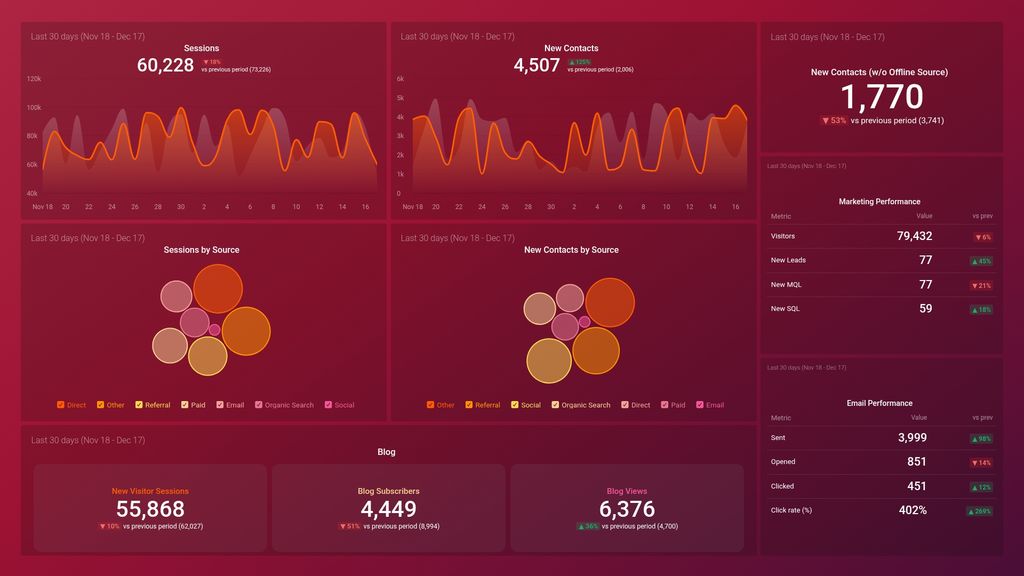
Use this free dashboard template to track important metrics from HubSpot like sessions by source, contacts by lifecycle stages, email performance, landing page performance, blog performance, and more.

Uses one-click integrations:

  • HubSpot Marketing HubSpot Marketing

If you don’t use HubSpot Marketing, you can pull data from any of our 100+ one-click, native integrations or from spreadsheets, databases and other APIs.

Get this dashboard for free

What you’ll learn from this HubSpot Inbound Marketing Performance Dashboard template

Connect your HubSpot Marketing account and learn:

  • Where’s the bottleneck in our sales funnel? See how your contacts are progressing through the buyer’s journey by tracking the number of leads in each lifecycle stage. This way you’ll be able to tell how well your leads are being nurtured, qualified, and transferred from marketing to sales and determine where the bottlenecks are for closing more deals.
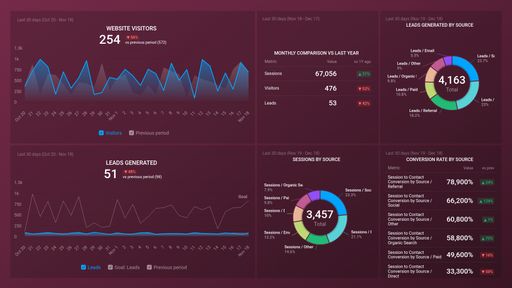
  • Which sources drive the most traffic to my website? Track Sessions by Source to quickly identify the traffic channels that are driving the most traffic to your website. Invest more in the channels that are already working well and make adjustments to the ones that are not.
  • How effective are our calls-to-action (CTAs) and landing pages? Quickly measure the engagement of your landing pages and the CTAs that are featured throughout your website. Use this information to determine whether you need to make adjustments in order to increase conversions.
  • How many people are opening and/or clicking our emails? Track the high-level engagement of your email marketing campaigns by measuring the number of subscribers that have opened and/or clicked your emails. Compare performance to previous periods to gauge whether your email strategy is improving or whether you need to make adjustments.
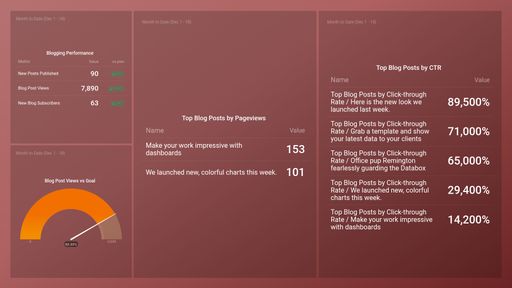
  • How many people have subscribed to our blog? Analyze the performance of your blog by tracking the number of email subscribers you have generated this month, this quarter, or even this year. Use this information to further optimize your blog’s conversion rate.

Pull additional data using our deep integration with HubSpot Marketing.

What else can you track and visualize with our deep integration with HubSpot Marketing? When it comes to traffic and conversions, almost anything:

  • Website traffic and conversions
  • Traffic and lead demographics
  • Landing page performances
  • The conversion rate(s) throughout your marketing and sales funnel(s)
  • Track and compare the efficiency of your marketing campaigns
  • Monitor campaign improvements and growth over time

There are many, many different metrics and metric combinations you can track using HubSpot Marketing. And in Databox, you can quickly visualize 100s of HubSpot metrics in a variety of different ways, alongside all the important metrics from other data sources you’re using.

Read more about Databox’s HubSpot Marketing integration.

HubSpot Marketing HubSpot Marketing metrics included in this template
  • New Customers

    New Customers Created during the specified Date Range (include Offline Source).

  • New Opportunities

    New Opportunities Created during the specified Date Range (include Offline Sources).

  • Page CTA Views

    Number of on-page Call-to-action Views during the specified Date Range.

  • New Visitor Sessions

    Number of Sessions from New Visitors during the specified Date Range.

Customize dashboard
Explore all of Databox’s functionalities:

Customize this dashboard with Databox

Sometimes, you’ll want to dive deeper into performance. When you need to customize this template (or any other dashboard) to include different metrics, add metrics from different sources, etc., you can do so by using Databox’s Dashboard Designer.

The Designer allows you to easily drag-and-drop metrics and visualizations from any data source right into your dashboard.

Get Started