
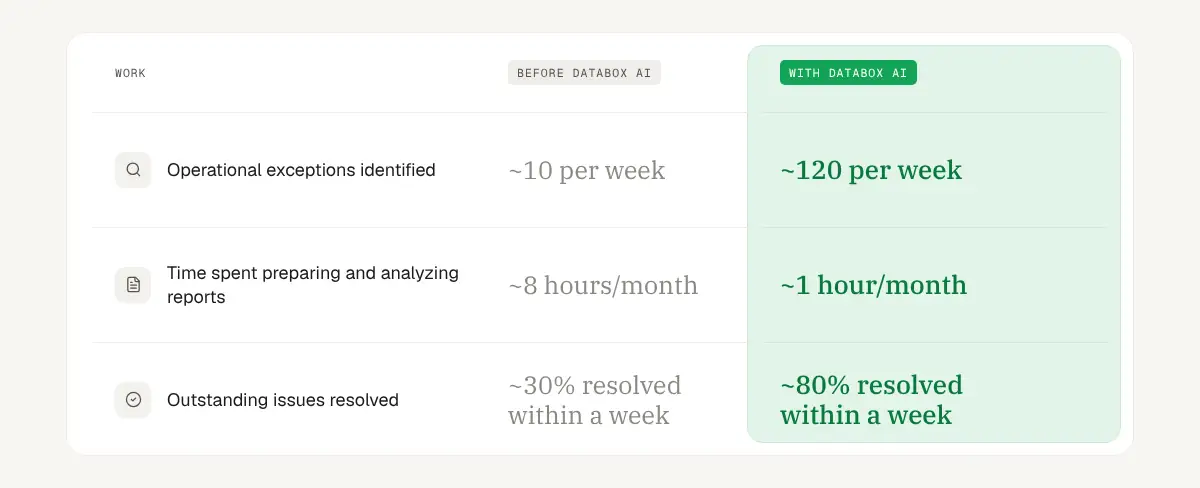
Results at a glance
Bringing reporting across both businesses into one place
Martin and his teams had been using Databox for several years to centralize reporting across both businesses and monitor performance. Shared dashboards and automated reports helped teams track their KPIs, including those tied to employee bonuses.
While this made performance easier to follow, Martin and his colleagues still did much of the data analysis themselves.
Adding AI analysis to their existing reporting
Martin had already been exploring other AI tools to help with data analysis. When Databox introduced the AI Analyst, he saw an opportunity to bring that work into the platform his teams already used.
“When Databox came out with their AI capability, because of the fact that it’s all in one place, that’s what really attracted me,” Martin says.
Databox already held the data and metrics the teams used to monitor performance. By adding the company’s vision and objectives and connecting additional tools, the AI Analyst could pull information beyond traditional metrics to help deliver more detailed insights.
Giving the AI Analyst more operational information to work with
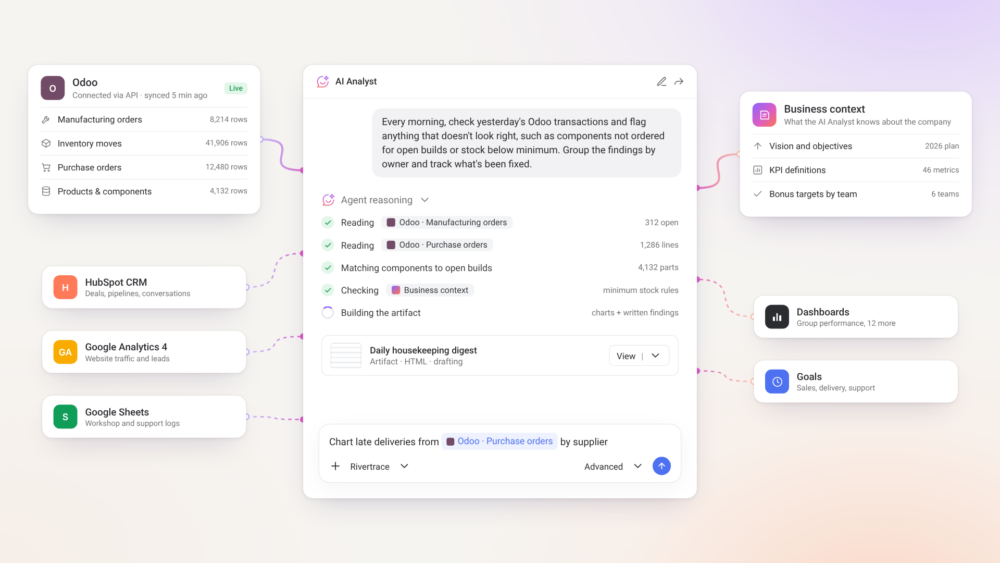
One of these tools was Odoo, an ERP system that held detailed information about manufacturing, inventory, and purchasing.
Since Odoo wasn’t an out-of-the-box Databox integration, Rivertrace connected it via API, bringing regularly updated operational data into Databox for the AI Analyst to analyze.
Martin then worked with the AI Analyst to build reports around the information his teams needed. He described what each report should cover and how the findings should be presented, refining the output through follow-up prompts until he was happy with the result.
The reports were created as Artifacts, combining written analysis with charts that employees could easily review.
“The reports are presented really nicely, so they’re very easy to read. They’re a mix of written insight and graphical illustrations of all of those points,” Martin says.
Using daily housekeeping digests to find operational issues
One workflow Martin set up was a suite of daily reports the team calls “housekeeping digests.”
The AI Analyst reviews manufacturing, inventory, and purchasing transactions and identifies exceptions for employees to investigate. Martin explains just how granular that analysis can get:
“A typical product might require us to source 40 different components. It can highlight that 39 are fine, but one hasn’t been ordered and needs attention within a specific timeframe. It gets down to that level of detail. Across the business, we have more than 4,000 part numbers to monitor.”
The findings are emailed to the person responsible for that area of the system, giving them a focused list of items to check. Employees can follow the findings back to the relevant systems, investigate what happened, and make the necessary changes.
“You literally give the team a list every day: ‘This doesn’t look right. Can you investigate?’” Martin explains.
The next day’s digest then tracks progress. It shows how many exceptions were identified the previous day, how many have been fixed, and what remains outstanding.
Fewer outstanding issues and less time preparing reports
Martin is already seeing the number of exceptions identified by the housekeeping digests decline as employees work through the issues being surfaced.
For him, that directly affects how teams work day to day.
All of those exceptions that we identified at the beginning are now starting to come down. That all makes an impact on people’s day-to-day jobs, because they’re not dealing with reactive things; they’re then able to be proactive.
 Martin Saunders
Managing Director, Rivertrace
The wider Databox setup is also changing how Martin and his teams spend their time:
- Hours of report preparation are being removed. Martin estimates that automating data transfers and recurring reporting across three or four systems saves “hours, if not days, a month.”
- Sales teams have clearer follow-up priorities. The AI Analyst monitors four HubSpot pipelines for issues such as expired deals and reviews customer sentiment to surface conversations that may need attention.
- More time goes into analysis instead of preparing the data. Martin says he now spends more time analyzing information with the AI Analyst rather than getting data into the right format and making it visible to the business.
Beyond the time savings and day-to-day improvements, Martin sees the bigger impact in how the information helps him think about where the business is heading.
“You’ve got better data at your fingertips to be able to make a decision. And you can think clearer in terms of where we are going—not just next month, but next year and five years from now,” Martin says.
Martin’s advice for getting started
For businesses considering a similar approach, Martin recommends getting the underlying data and context right first.
“You’ve got to make sure that the foundations are right. Trying to put an AI layer over chaos will multiply chaos. You have to fix the issues in your data, or at least have a way to monitor them. We use AI to help with that too, identifying data discrepancies, data cleanliness and discipline issues, and other housekeeping problems,” Martin says.