

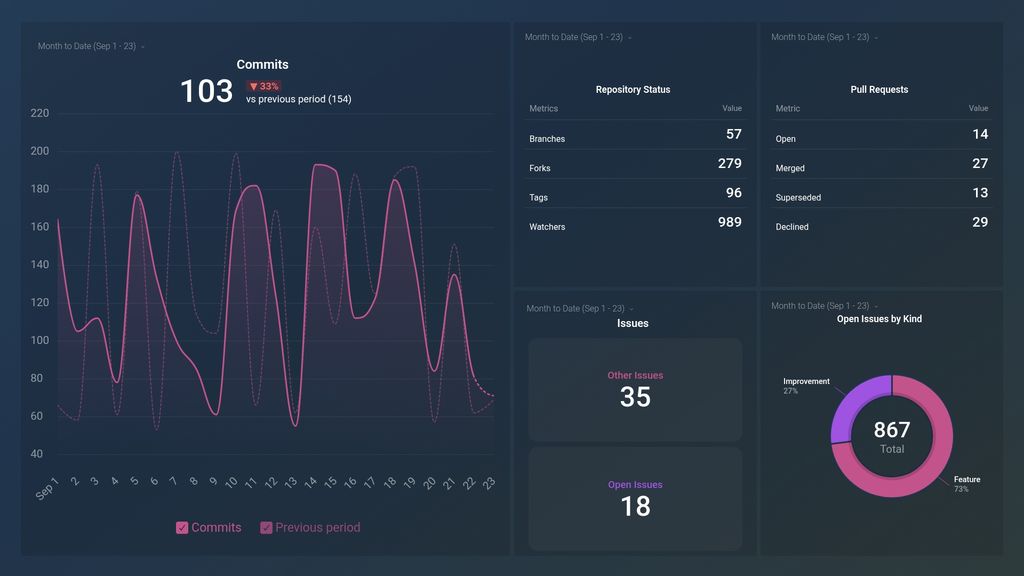
What you’ll learn from this Bitbucket Overview Dashboard Template:
By using this powerful collaboration tool, your software team will be able to execute projects in a timely and organized manner. Here’s what you’ll learn from connecting your BitBucket account with Databox:
- How many changes were made to our project this week? See the number of commits made by users to a project or repository on a daily basis. Compare these stats to the previous month.
- How do we track the status of all requested code reviews by my team? Monitor the status of all proposed code changes to your file at any given time. This is useful to track to stay informed on the necessary changes needed to deliver quality code.
- How many unresolved issues do we have at the moment? Get a real-time account of all open issues your team needs to take action on in a given time period, from feature requests to bug reports and other pending project tasks.
- How do I check the status of a repository? Check the status of your project file(s) by tracking crucial metrics that’ll enable you to make quick, informed decisions.
Pull additional data using our deep integration with BitBucket.
What else can you track and visualize with our robust integration with BitBucket?
When it comes to evaluating your software team’s performance, almost anything:
- Top contributors
- Repository activity
- Branches
- Tags
- Watchers
There are many different metrics and metric combinations you can track using BitBucket. And in Databox, you can quickly visualize 100s of Bitbucket metrics in a variety of different ways.
Read more about Databox’s BitBucket integration.
Explore more Bitbucket dashboards.
