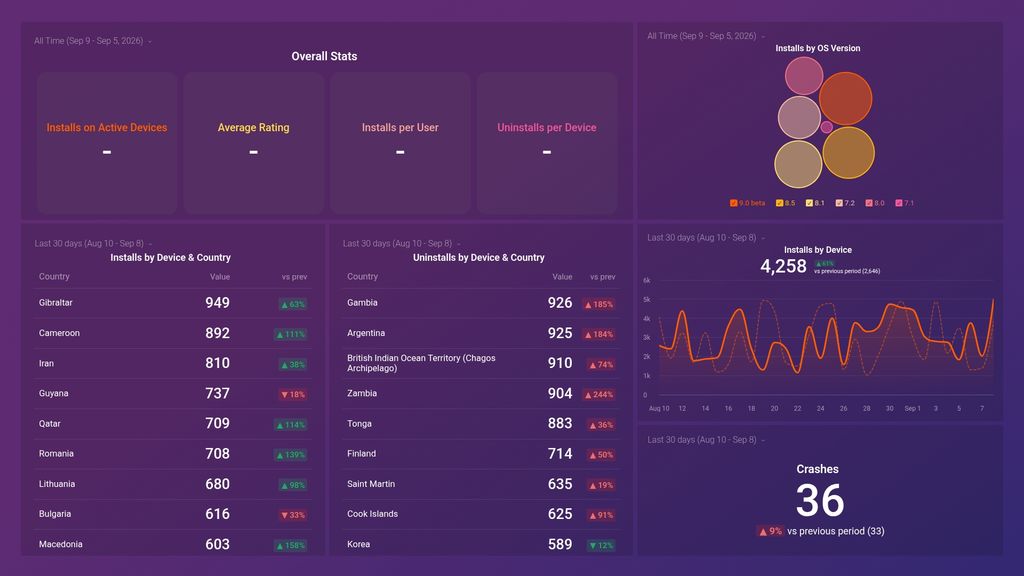
What you’ll learn from this Google Play Store Metrics Dashboard Template:
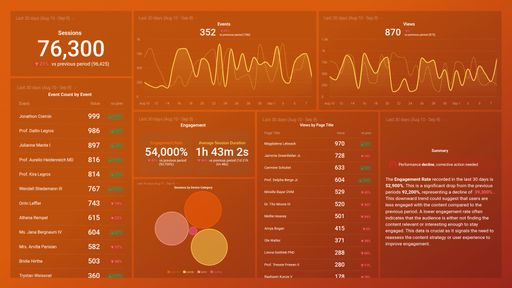
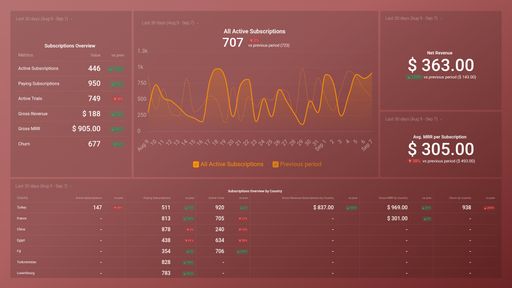
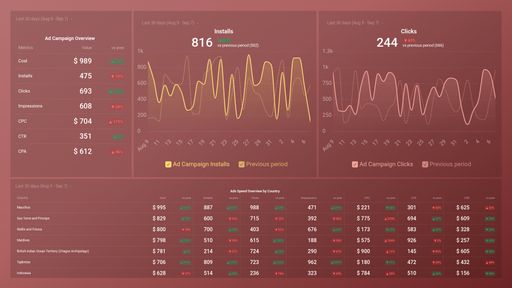
This Google Play Store Metrics Dashboard Template will provide you with instant access to information on your app’s performance and engagement metrics. By connecting your Google Play Store’s account, you’ll learn:
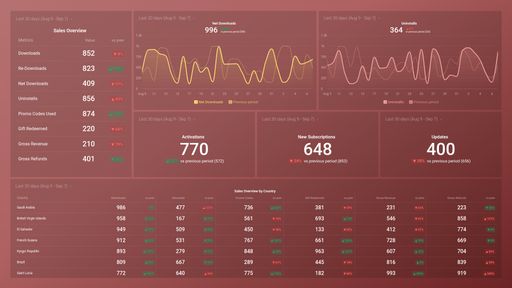
- How do I track my app install and uninstall metrics? Measure your acquisition and retention efforts based on the number of users that installed or uninstalled your app during a period of time. Find out where most of your users installing or uninstalling your app are geographically located, use this information to improve your retention strategy or ad campaign to ensure you’re bringing in quality users that won’t churn after a short period of time.
- How many times did my app crash last week? View the number of times your application crashed at any given time. As this impacts your user experience it is important to diagnose the cause(s) and solve them in a timely manner.
- How many people installed my app today? Get daily updates on your app installs, it is important to pay attention to your app installs data as it lets you know if your acquisition efforts are paying off or not.
- Is there a way to track my app’s average daily ratings? Monitor your app’s user sentiment and feedback in real-time. It is critical to pay attention to this data as apps with great ratings tend to rank higher in search results and are more likely to be installed by others as it’s a testament to the performance, usefulness, and quality of your app.
- Which device has the highest number of installs? See how many people downloaded your app and successfully opened it for the first time on a particular device, such as mobile, desktop, or tablet. Visually monitor the number of installs each device type accumulates daily. Use this information to improve or change your acquisition strategy across all devices.
- Which device has the highest number of uninstalls? Find out how many users deleted your app in a day/week/month/year and the type of device they use. Use this data to dig deeper into why these users churned, as well as to optimize your app’s experience for a higher ROI and a more active user base.
Pull additional data using our robust integration with Google Play.
What else can you track and visualize with our deep integration with Google Play? When it comes to analyzing your app’s performance data, pretty much anything:
- Conversion rate
- App quality and performance
- User acquisition, retention, and satisfaction
- Event tracking
- Trends in user rating
There are numerous metrics and metric combinations you can track using the Google Play Store. And in Databox, you can quickly visualize dozens of Google play metrics in various ways.
Explore more Google Play dashboards.