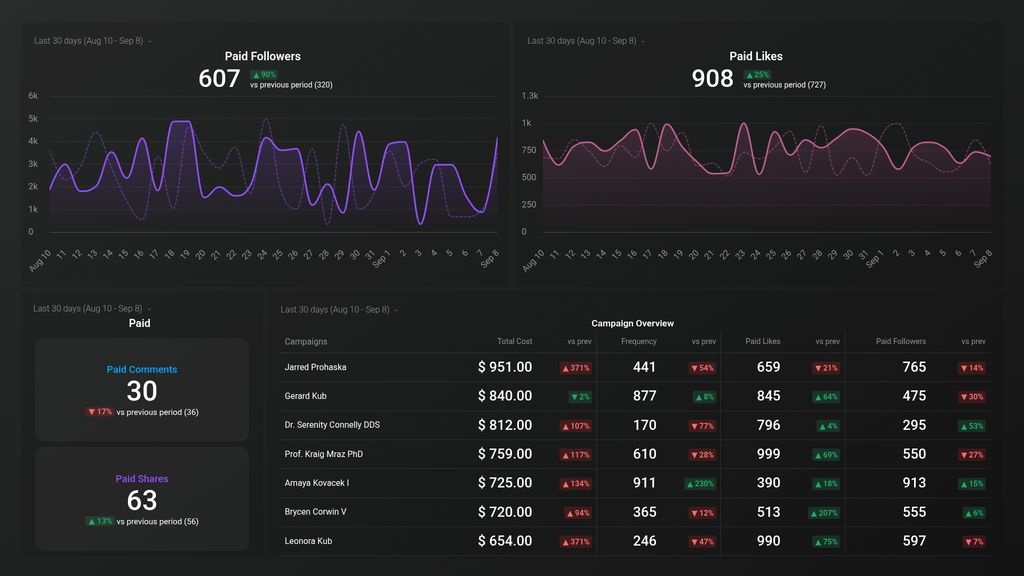
What you can learn from this TikTok Ads Engagement Overview Dashboard Template
Connect your TikTok Ads account, and you’ll learn:
- How are my ad campaigns trending within a desired time frame? Track the number of frequency, paid likes and paid followers your campaigns receive within the determined time period. You can also compare them to previous periods to see if there are any major changes. And if you notice a significant change in numbers take the time and drill deeper to find the root causes.
- What are our highest-performance TikTok Ad campaigns? Which campaigns receive the most lkes and followers? Which has a lower frequency? Measure and compare campaigns so you can make adjustments accordingly.
- Are the numbers of your TikTok Ads campaign's comments and shares on the rise? Track the numbers of comments and shares for your TikTok Ads campaigns and monitor their trends in real time. If they start trending down over longer time period it is time to take steps and change the current PPC strategy.
- How often are people seeing your ads in their news feeds? Keep track of frequency of your ad campaigns. Compare what you're seeing to previous time periods.
Pull additional data using our deep integration with TikTok Ads
What other campaign metrics can you track and visualize with our integration with TikTok Ads? Almost anything:
- Individual campaign and ad performance
- Clicks, downloads, leads, and sales
- Cost per impression (CPM), click (CPC), and lead (CPL)
- Return on ad spend (ROAS)
- Ad spend and overall budget
- Progress towards your campaign goals, and more
In Databox, there are almost 100 TikTok Ads metrics already built and ready for you to visualize in a variety of different ways. With the use of Metric Builder and Data Calculations, the range of different metrics and metric combinations you can track from TikTok Ads widens.
Read more about Databox’s TikTok Ads integration.