Databox is now an agentic analytics platform. AI that analyzes, reports, and acts on your performance, built on your data, your metrics, and your business context.
TL;DR
- Databox is now an agentic analytics platform: AI that analyzes, reports, and acts on your performance, working from your data, your metrics, and your business context.
- Agentic analytics means AI does the analytical work itself. It answers questions, builds reports, monitors performance continuously, and delivers findings without anyone asking.
- It only works on a real foundation. Databox builds in all four parts: connected data, governed metrics, business context, and a statistical engine, with no warehouse or data team required.
- Genie, your AI Analyst, is how you use it: ask questions, build metrics, dashboards, and reports, and automate recurring analysis through conversation. It’s live in your account today.
- Agents come next: delegate whole jobs, from recurring analysis to next steps, within limits you set.
For years, growing companies struggled to see how they were performing. The data existed, but it lived in ten different tools, and getting the full picture meant hours wasted every reporting cycle manually inputting numbers into a spreadsheet or slide deck. Dashboard and reporting software changed that. Connect your tools once, define the metrics to track for your business, and everyone could see the numbers in one place.
Databox has spent the last decade making that possible for thousands of companies. But a dashboard only shows you what happened. Improving performance requires knowing why it happened and what to do next. That takes time and skill, and in most companies both belong to a few experienced people who are already stretched too thin. So the analysis arrives late or not at all, and often the window to act is gone.
The pull toward AI for this work is obvious, and teams are already handing recurring analysis to it. In practice, most hit the same wall: point AI at raw exports, and you get confident guesses. To produce analysis a business can act on, AI needs all of the data, organized properly, with enough context to understand the business.
The industry now has a name for this shift, where AI does more of the analytical work itself: agentic analytics. It marks the biggest change in how companies manage performance since dashboards, and it is where we have taken Databox.
What is agentic analytics?
Agentic analytics is the use of AI to perform data analysis and take action, autonomously. Rather than waiting for someone to open a report, the AI continuously monitors your data, detects patterns and anomalies, reasons about the results, and surfaces insights on its own, with minimal intervention.
Agentic analytics comes down to four capabilities:
- Analysis through conversation. You ask a question in plain language, and the AI determines the approach, runs the analysis, and returns an answer with the reasoning behind it.
- Builds what you need. Describe what you need, and the AI builds it: the report, the dashboard, the metric.
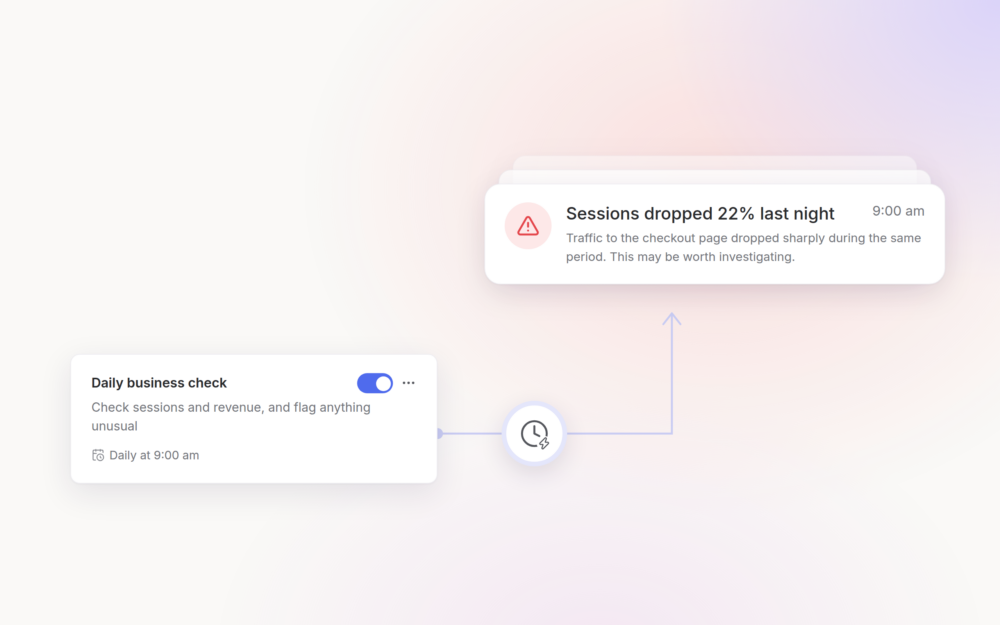
- Insight delivery. The AI watches your performance continuously, monitoring for issues and pace to goals, and delivers analysis when something changes or on the schedule you set.
- Agentic actions. The AI executes next steps based on the analysis, so you can delegate work to the system, with an approval step and full oversight.
Over the past few months, we’ve been rebuilding Databox around exactly this. Today, we’re relaunching Databox as an agentic analytics platform.
What it takes to do agentic analytics right
The four capabilities above are only as good as what sits underneath them. AI can only produce analysis a business acts on when it has access to all of the data, organized properly, with enough context to understand the business.
Most platforms in this category solve it with a data warehouse, a modeling project, and a data team to maintain both, which means months of setup before the AI answers its first question. We built the foundation into the platform instead, so the setup that stops most teams is already done, and the AI is ready to work the day you connect your tools. The foundation has four parts.
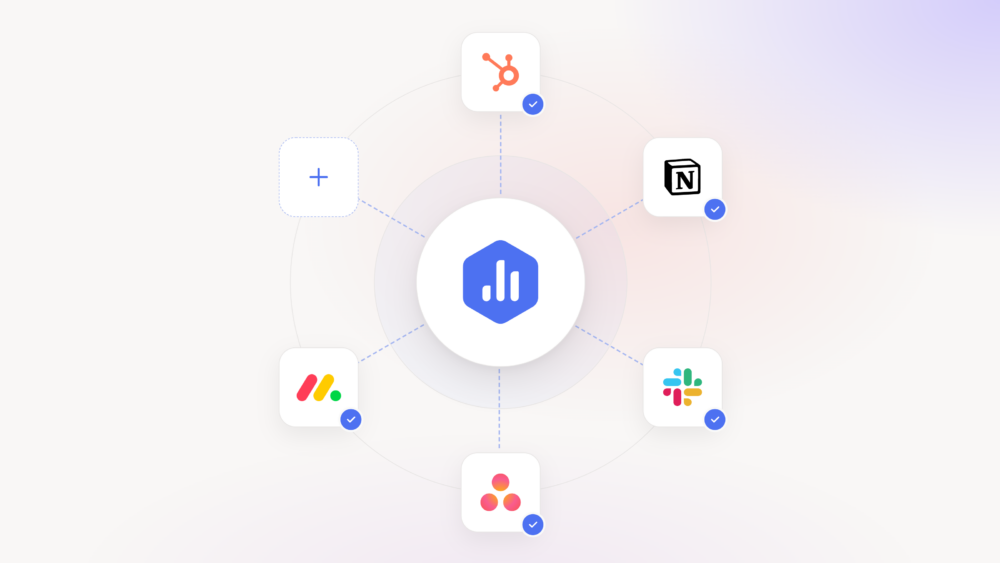
- A connected data layer. Databox connects to 130+ tools, plus databases, warehouses, spreadsheets, and custom APIs, and keeps the data synced automatically. Ask a question, and the answer draws on your whole business, with nothing exported, uploaded, or pasted in first.
- A governed metrics layer. Databox comes with thousands of prebuilt metrics, each one already defined with its source, calculation, and dimensions, and you can build your own the same way. A definition is stored once and used everywhere that metric appears. When you ask about MRR, the AI isn’t working from a definition it found online. It’s working from yours, calculated the way your business calculates it, in every answer, no matter who asks.
- A business context layer. Alongside the data, Databox holds what explains it: your goals, plans, history, documents, memory from past conversations, and context from your connected systems. The prompt that starts with three paragraphs of background goes away. The AI already knows what you launched, what you’re targeting, what changed last quarter, what your team discussed yesterday and what your customers said to you last week, and its analysis accounts for all of it.
- A built-in analytics engine. Trend analysis, anomaly detection, correlations, forecasting, and scenario modeling are built into the platform and run directly on your governed metrics. Whether a drop is a real problem or normal variation is answered with statistics, computed the same way every time, rather than estimated by a language model on the fly. When you want to make a decision, you can mathematically model what’s likely to happen based on your investments, plans and decisions.
Each layer answers a reason people don’t trust AI with their numbers. Without complete data, the AI analyzes only what it can retrieve and makes confident guesses. Without governed definitions, it picks a way to calculate your metric, which may be completely wrong for that metric and it may pick differently tomorrow. Without context, the answer is technically correct but useless. Without real statistical methods, the analysis is improvised. Any one of these puts you back to verifying every answer supplying the data, and adding the context, and at that point the AI isn’t doing the work; you are.
Inside the new Databox
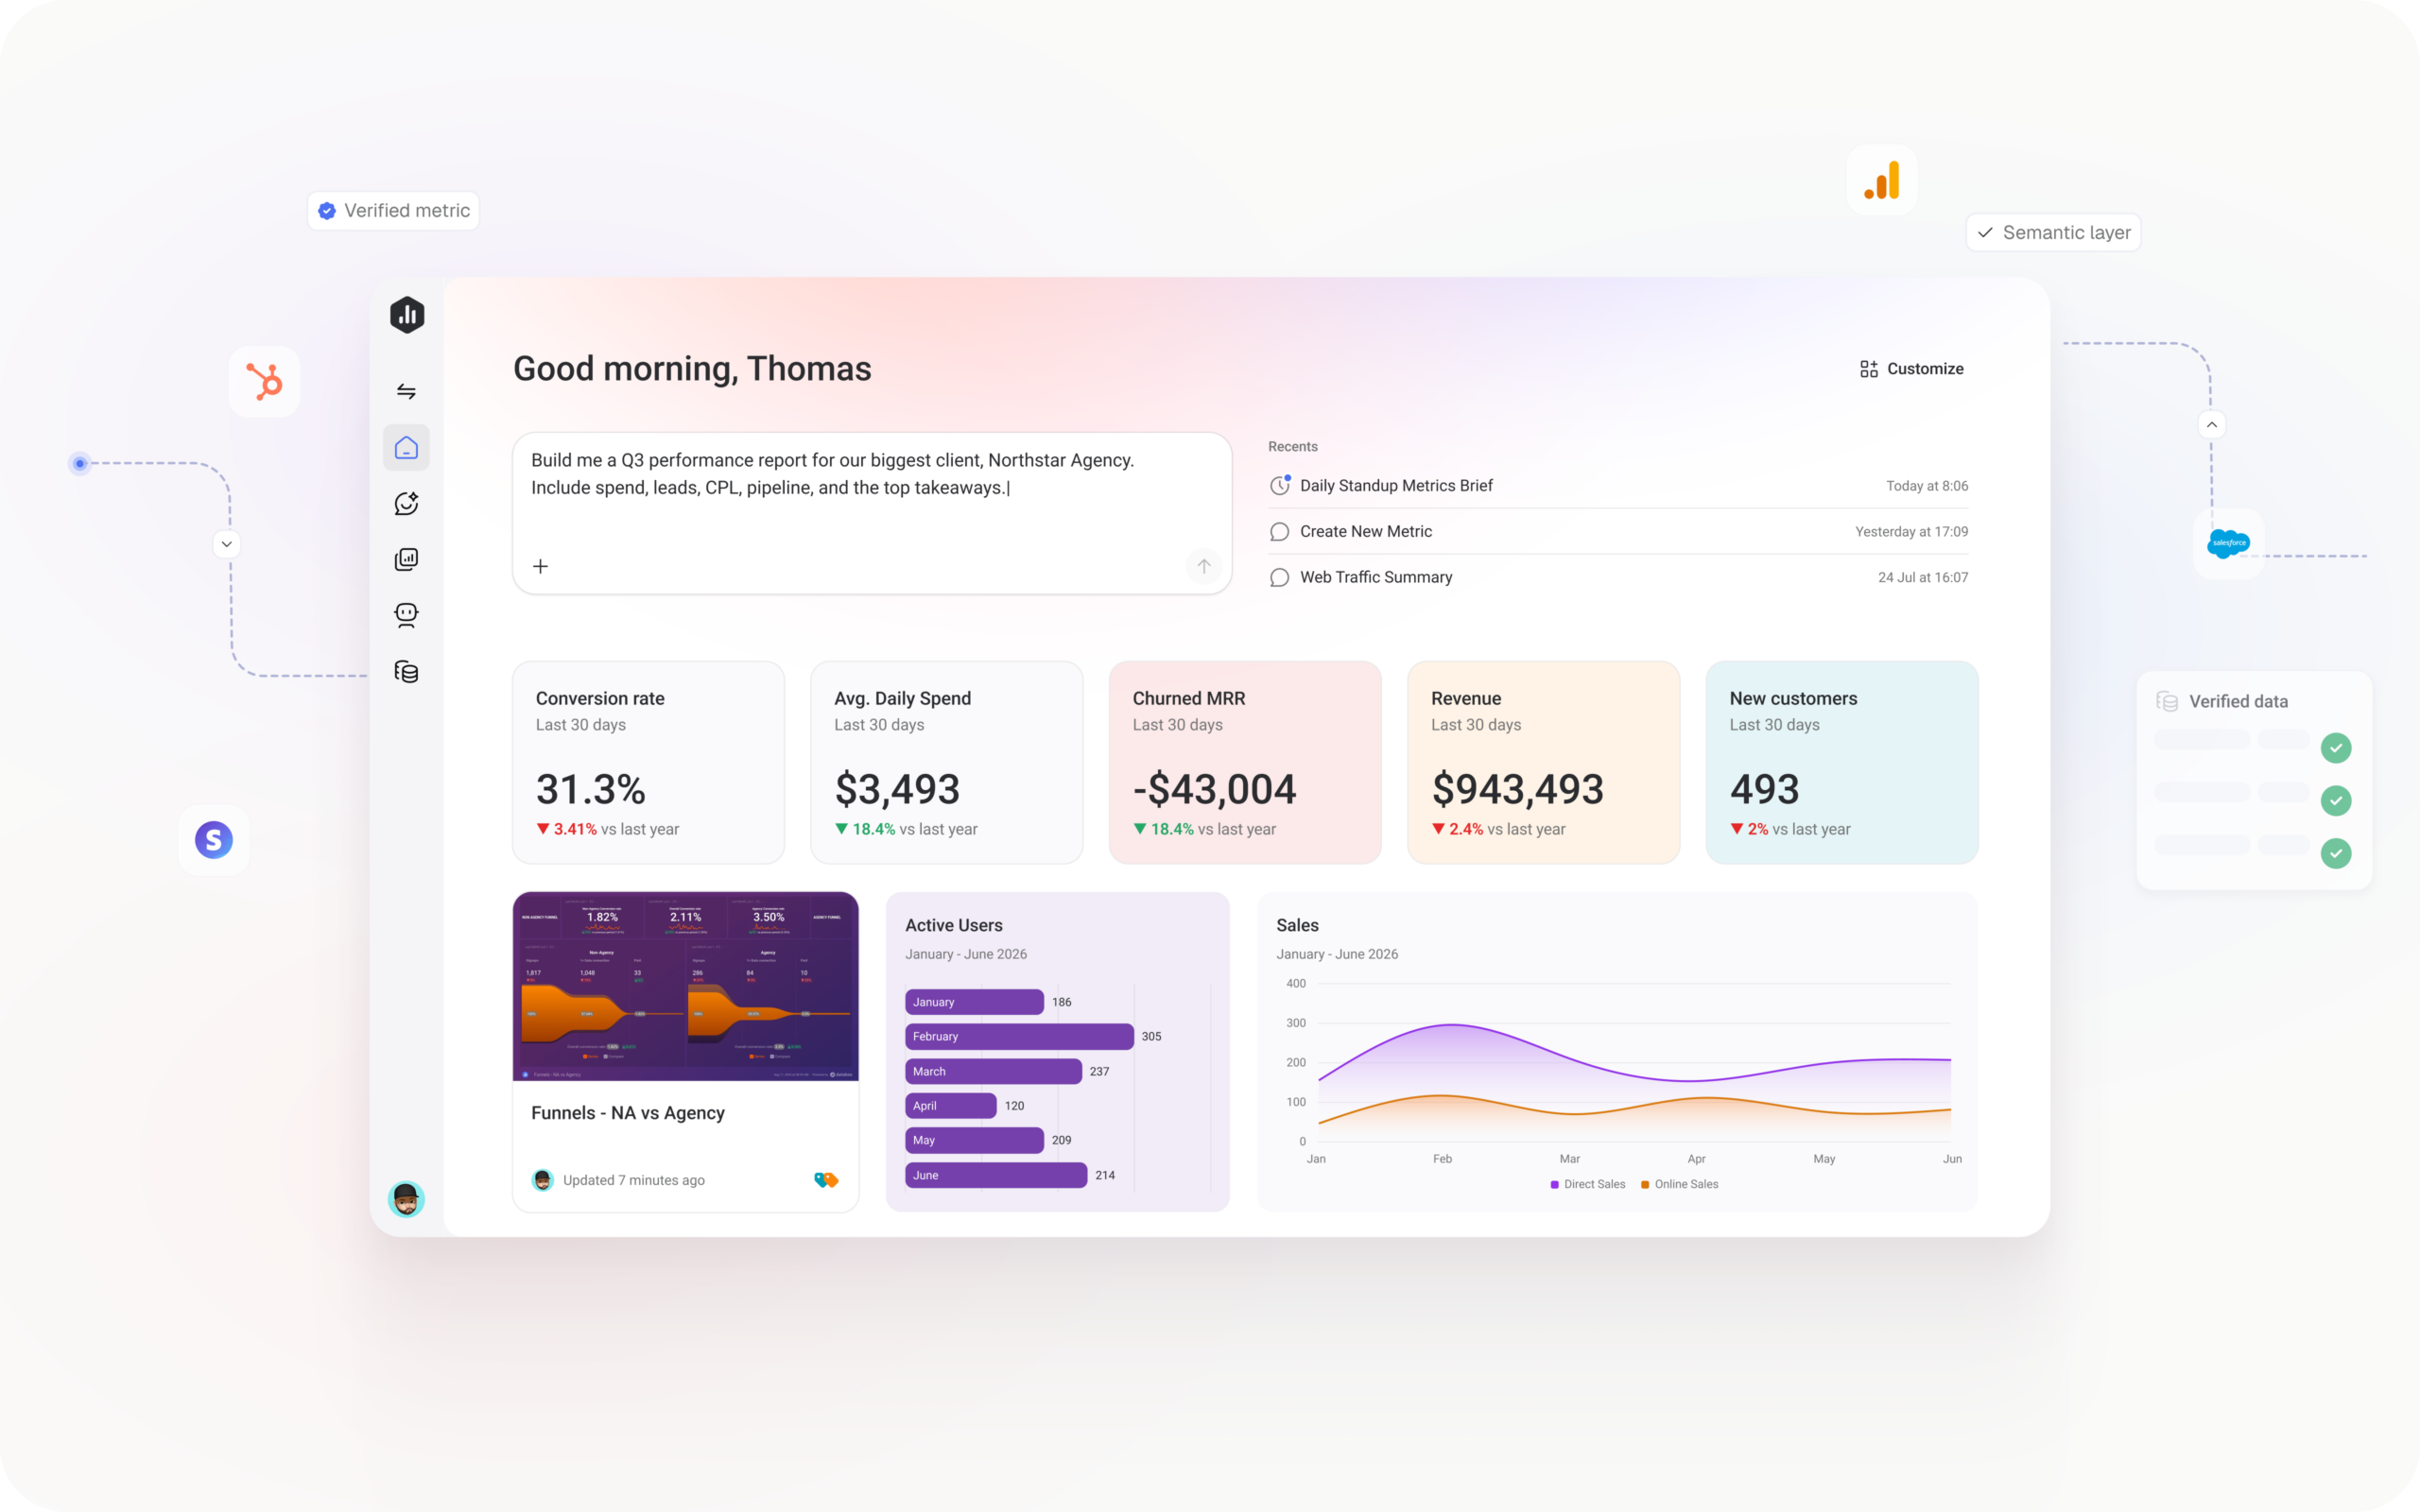
At the center of it all is Genie, your AI Analyst. Ask it questions about performance, build metrics, dashboards, and reports, or automate recurring analysis, all through conversation. It works from everything above to deliver insights you can trust and act on from day one.
- It analyzes your performance: Ask Genie a question about your business and you get an answer in seconds, pulled from your live metrics. The analysis runs on your data, your definitions, and your context, and the answer comes with the reasoning behind it. If the answer raises a better question, ask that one next.
- It builds for you: Anything you used to build by hand, you can now describe: metrics, dashboards, goals, reports. Genie builds them. When an analysis is worth keeping, turn it into an Artifact, an editable report you can refine and share.
- It follows your instructions: Skills store the instructions behind repeatable work. Which analysis to run, what standards to follow, how the output should look. Run a Skill and Genie does the job the way your team defined it every time. The Skills Marketplace adds ready-to-install Skills built by experts and partners.
- It works without being asked: Routines run a prompt or a Skill on a schedule and deliver the results automatically, so recurring analysis and reporting happen with no one kicking them off.
- It knows your business: Genie’s memory carries what it learns across conversations, its knowledge holds your documents and call notes, and MCP connectors pull context from your other tools, so its analysis reflects how your business runs.
- It goes where you work: Through the Databox MCP, Genie’s foundation, your data, definitions, and context are available inside Claude and the other AI tools your team uses.
What’s next: Agents
Everything you’ve read about is live in your account today. The foundation is built, the analysis runs on it, and that sets up what comes next: Agents.
Agents will let you delegate whole jobs: the recurring analysis, the reporting that follows it, and the actions that follow the findings, all within limits you set, working from the same data and context as your team.
Delegation is the real test of trust in AI. You’ll only hand work off when you know what it runs on, and that’s exactly what we’ve spent this post explaining. We’ll have more to share soon.
See it live on September 29
On September 29, we’re hosting a live event to walk through the new Databox end-to-end: the platform, how agentic analytics works in practice, and what’s shipping next, including Agents. If you want to see everything in this post running on real data, that’s the place.
The agentic era of Databox
For a decade, Databox worked on making performance easy to see. The harder problem was always what came after: the analysis, the interpretation, deciding what to do, and taking action – work that stayed manual because it needed skill and time most teams didn’t have. That’s the problem agentic analytics finally solves, and it’s the opportunity the new Databox is built around. The data connected, the metrics governed, the context understood, and AI doing the analytical work on top of it all.
If you’re a Databox customer, start chatting with Genie. It already works from your metrics, dashboards, and reports, so there’s nothing to set up. Ask it the question you’d normally save for whoever has time to dig in. Use it to build an artifact that you can share with your team.
If you’re not, start a 14-day free trial, connect your tools, and ask the same question.
Frequently Asked Questions
What is agentic analytics?
Agentic analytics is the use of AI to perform data analysis and take action, autonomously. Rather than waiting for someone to run a report, the AI monitors data continuously, detects patterns and anomalies, reasons about results, and surfaces insights on its own, with minimal intervention.
What changed in Databox?
Databox relaunched as an agentic analytics platform in September 2026. Genie, the AI Analyst, is now the main way to work with the platform: it analyzes performance, builds metrics, dashboards, and reports, and runs recurring analysis through Skills and Routines
Do I need a data warehouse or data team to use it?
No. Databox builds the foundation into the platform: 130+ integrations with automatic syncing, thousands of prebuilt metric definitions, business context storage, and built-in statistical methods. You connect your tools and start asking questions.
What can Genie, the AI Analyst, do today?
Genie answers performance questions with reasoning, builds metrics, dashboards, goals, turns analyses into editable Artifacts, follows Skills your team defines, and runs recurring analysis on a schedule through Routines. It works from your connected data, metric definitions, and business context.
What are Databox Agents?
Agents are coming next. An Agent takes on a defined job, recurring analysis, the reporting that follows, and the actions that follow the findings, within limits you set and with your approval on next steps.