


Already have an account? Sign in
Sign up for free
Connect your datasources and instantly see your data in this template.
Creating your account...
Stop copy-pasting screenshots into slides. Save hours of reporting work every month, and share up-to-date social media performance metrics you need with anyone.


With Databox’s marketing reporting tools you utomatically collect and send share media data, eliminating the need for screenshots or pulling information from multiple sources. Keep your organic and paid social KPIs front and center, ensuring your team stays focused on what matters most. With real-time insights, you can make better, data-driven decisions and address issues immediately—before they impact your performance.

Centralize your data for a complete view of all your social media metrics without the hassle of switching between tools. Just log in and plug data into your reports and dashboards in clicks using 100+ native integrations.

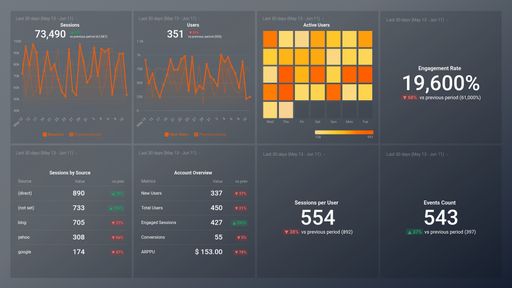
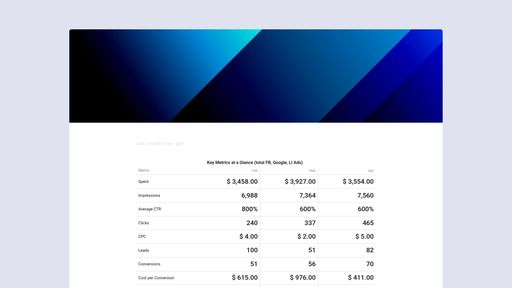
Quickly visualize social media dashboards (organic and paid) using our drag-and-drop designer and pre-built metrics. Drill down into campaigns, blend insights from multiple platforms, benchmark, compare time periods, and more.

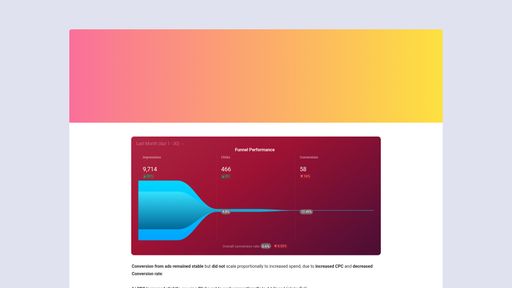
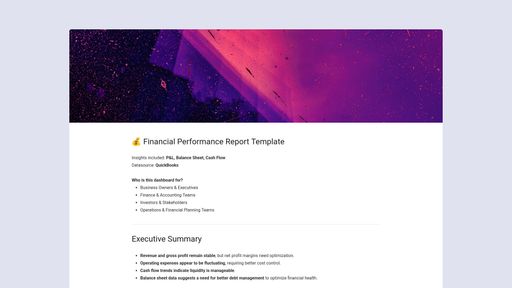
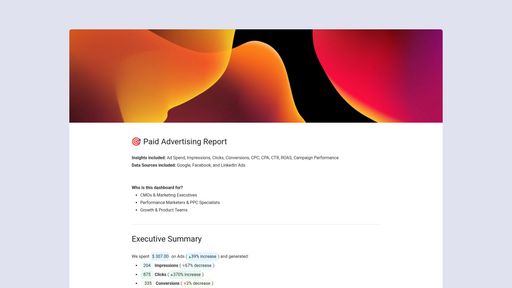
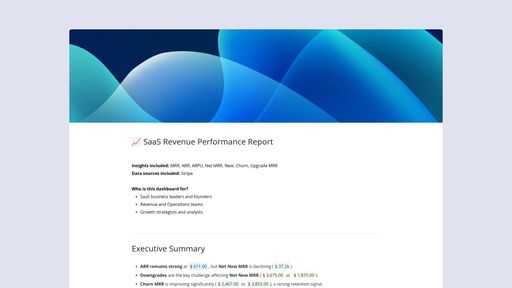
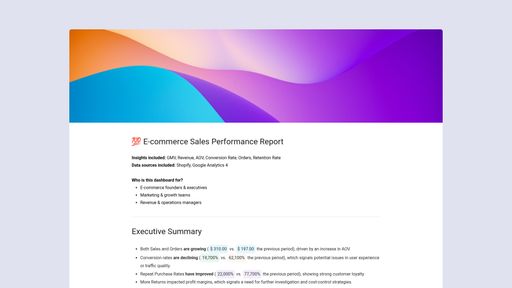
Create reports offering a comprehensive view of your historical social media performance, with all the context for your teams, clients, or stakeholders. Build reports from scratch, pull in dashboards, and easily customize them to fit your needs.
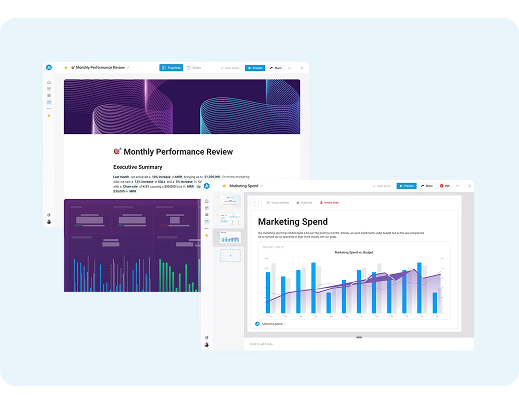
Choose from a long-form Page format for deeper insights or a Presentation format with speaker notes and full-screen mode. Embed your existing Databoards, Metrics, and Goals easily and integrate them directly into your reports. Then add covers, formatted text, images, or data stories to provide context, or combine visuals and text side by side for a more dynamic layout. Tailor them to reflect your company’s branding, ensuring they align with your unique style and messaging.
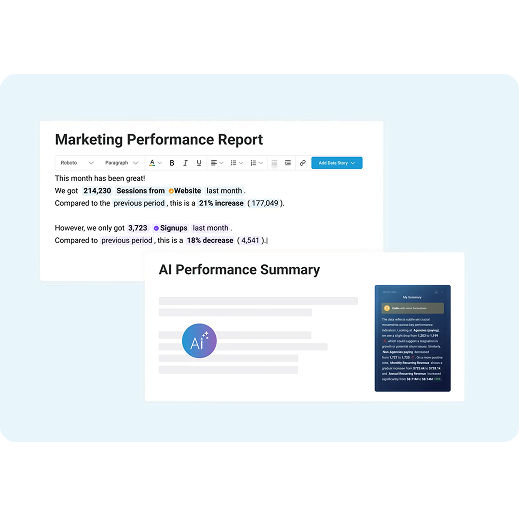
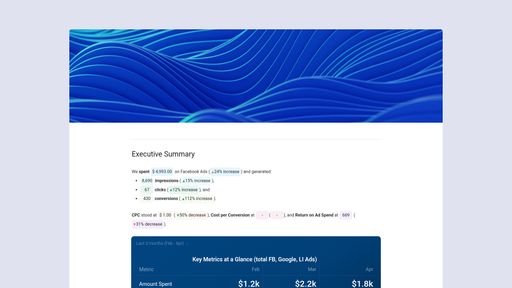
Typing up a thoughtful, original analysis for every report takes valuable time away from your brightest team members. With Data Stories, the hard work is already done for you. Even better—your text will stay up to date along with your data. Use them to help readers understand what they’re looking at, providing valuable context behind the numbers. Or use AI to summarize performance, fast.
You can also include speaker notes below slides to offer additional context or explanations, ensuring your audience fully grasps the insights you’re sharing.

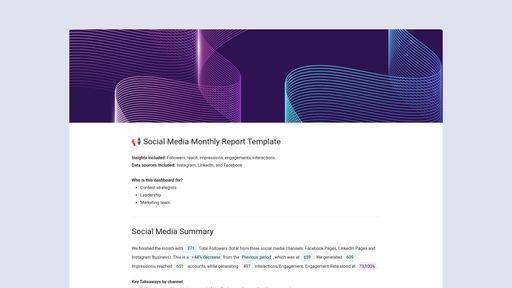
Building reports doesn’t need to take all day. Start with a ready-made social media report templates and tailor them to your needs. Then save reports as templates, so you can quickly launch future reports, ensuring consistency and saving time.
This streamlined process lets you focus on insights, while maintaining a professional and uniform format across all your reports.

Export PDF or share reports automatically via email or Slack, or even provide a public URL so stakeholders can view performance in live meetings. Set a schedule to automatically export your report daily, weekly, monthly, or quarterly. If you want to double-check the details before sending, set a reminder for a specified user to review and update the report if needed.

Drag & Drop your metrics
No-code editor
Fully customizable


And if you need important metrics from a different data source, no worries. You can connect powerful software integrations, APIs, Databases and custom Spreadsheets.
Trusted by 20,000+ growing businesses


What’s the difference between a Report and a Dashboard?
Dashboards are used to track and monitor your metrics in real-time. It gives you an answer to the question: “How am I doing right now”. They are ideal for “month-to-date” (or week-to-date, quarter-to-date, etc.) data. Our report generating tool, on the other hand, is designed to offer a more in-depth analysis of historical performance and trends. Typically sent as a PDF, reports cover broader time ranges like last month, last quarter, or last year.
How can I share a report?
Our business reporting tool allows you to share multiple ways:
I don’t want to schedule my report, can I download them as PDFs?
Yes. Every Report can be exported as a PDF.
What are Data Stories?
Data Stories are dynamic elements (like metric name, value, comparison periods, and more) that you can add to the text of your Reports. What makes it useful is that these dynamic fields are automatically updated with the latest data every time you send out a Report.
Is there an approval process before the reports are sent out?
Not yet. We will be rolling out a Reports Approval Process for both Growth and Premium plans in the future. Make sure to check the Product Update page for more information on all the latest features and improvements.
Can I start free?
Yes! Everyone starts with a free 14-day trial of the Growth plan. After your trial, choose to purchase any plan that best suits your needs.
What happens after my free trial?
During the 14-day trial, you can purchase a paid plan and your first payment will be at the end of the trial period. If you do not purchase, the trial will simply expire.We do not require a credit card to start a trial.
All Databox software and customer data are securely housed within Amazon AWS infrastructure, ensuring compliance with AWS security certifications and GDPR standards.
Compare
Databox Inc.
HQ: Boston, MA, USA
AI-powered analytics for teams that need answers now.
Databox Inc.
HQ: Boston, MA, USA

AI-powered analytics for teams that need answers now.


Compare
Connect your datasources and instantly see your data in this template.
Creating your account...