TL;DR
- To track Claude usage and costs in one dashboard, connect Claude to Databox with the no-code Custom Integration Builder and an Admin API key from your Claude Console, then ask the AI Analyst to create your metrics and build the dashboard.
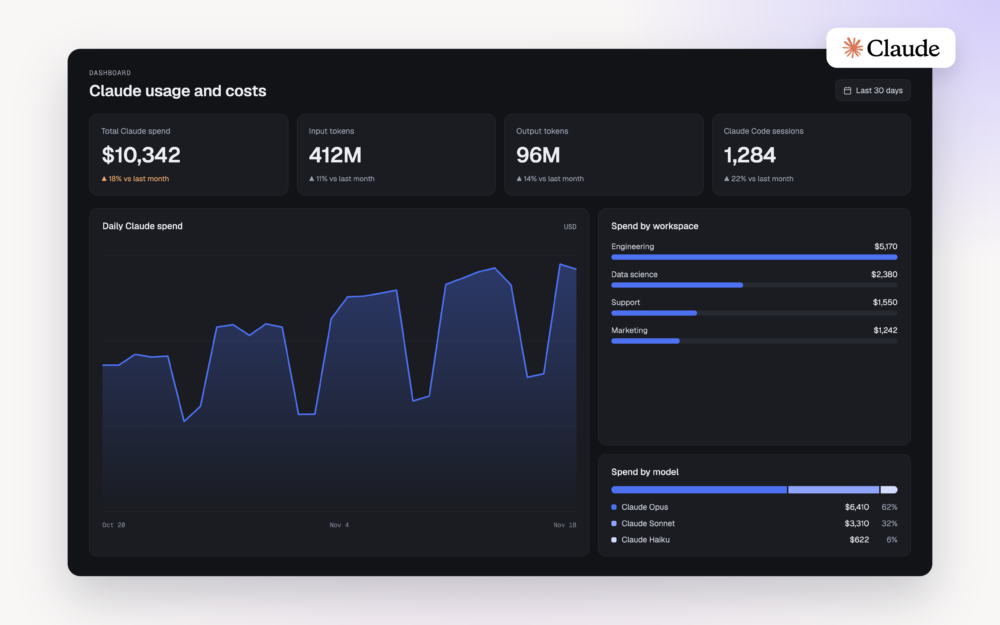
- The metrics worth tracking are total Claude spend, input and output tokens, costs by workspace, usage and costs by model, usage trends over time, and Claude Code usage.
- Once your Claude data is in Databox, you can share it with finance, IT, and leadership, compare it with other business metrics, forecast spending, and get alerted before costs exceed your budget.
- Routines let the AI Analyst review Claude spending every week and send a summary to your team by email or Slack.
- The Claude Console remains the source of truth for your Anthropic billing, and Databox adds team-wide access, analysis, and reporting alongside the rest of your business data.
As more teams use Claude for everyday work, tracking AI usage and costs is becoming increasingly important. Companies need to know how much they’re spending, where that spending is coming from, and how usage is changing over time.
Claude provides usage and cost reports, but that information is spread across separate views and sits outside the rest of your business reporting. When you need to review AI spending with leadership, compare it with other expenses, or forecast future costs, you often end up buried in a spreadsheet.
In this guide, I’ll show you how to bring Claude usage and cost data into Databox, so you can track spending, understand trends, and monitor AI costs alongside your other business expenses.
What Claude usage and cost metrics should you track?
To understand how Claude is being used across your organization, you need to look beyond your total monthly bill. Tracking usage alongside costs helps you see which workspaces are consuming the most resources, what’s driving spending, and how those patterns change over time.
Here are the key metrics worth monitoring:
- Total Claude spending: Track how much you’re spending on Claude over a given period and compare costs across weeks or months.
- Token consumption: Monitor input and output tokens to understand how much Claude is being used and what’s driving consumption.
- Costs by workspace: See how spending is distributed across workspaces, making it easier to compare teams or departments if each has its own workspace.
- Usage and costs by model: Understand which Claude models account for the most usage and spending.
- Usage trends over time: Track changes in token consumption, API requests, and costs to identify spikes or shifts in usage patterns.
- Claude Code usage: If your development teams use Claude Code, monitor developer activity, sessions, token usage, and estimated costs.
How to build a Claude usage and cost dashboard in Databox
You can bring Claude usage and cost data into Databox with a custom integration, then use the AI Analyst to turn it into a dashboard.
Here’s how it works.
1. Connect Claude to Databox
While Databox doesn’t have a native Claude integration, you can build your own using the no-code Custom Integration Builder. All you need is an Admin API key from your Claude Console, which you can use to authenticate the connection in Databox.
2. Choose the Claude data you want to track
Next, select the data you want to bring into Databox, such as date, workspace, model, and cost. Databox organizes this information into datasets and syncs it on the schedule you choose, so your dashboards and analyses stay up to date without manual exports.
3. Ask the AI Analyst to create your metrics
To visualize your Claude data, you’ll need metrics, and the AI Analyst can create them directly from your datasets. Simply describe what you want to track in plain English. For example:
The AI Analyst shows you how each metric will be calculated before saving it, so you can review the definitions. Once created, you can reuse these metrics across dashboards and reports, keeping your numbers consistent.
4. Build your dashboard
With your metrics in place, ask the AI Analyst to bring them together in a dashboard:
You can continue refining it through conversation, whether you want to add a breakdown or change a visualization. Once it’s ready, share the dashboard with your team or leadership so they can monitor Claude spending whenever they need to.
What else can you do with your Claude data in Databox?
Building a dashboard is just the starting point. Once your Claude data is in Databox, you can use it alongside your other business metrics, analyze changes in spending, and automate how you monitor and report on AI costs.
- Make Claude data accessible to more teams. Share usage and spending data with finance, IT, and leadership without giving everyone access to the Claude Console.
- Monitor Claude alongside other business metrics. Compare Claude spending with other AI tools, software expenses, budgets, or operational metrics to understand where your money is going.
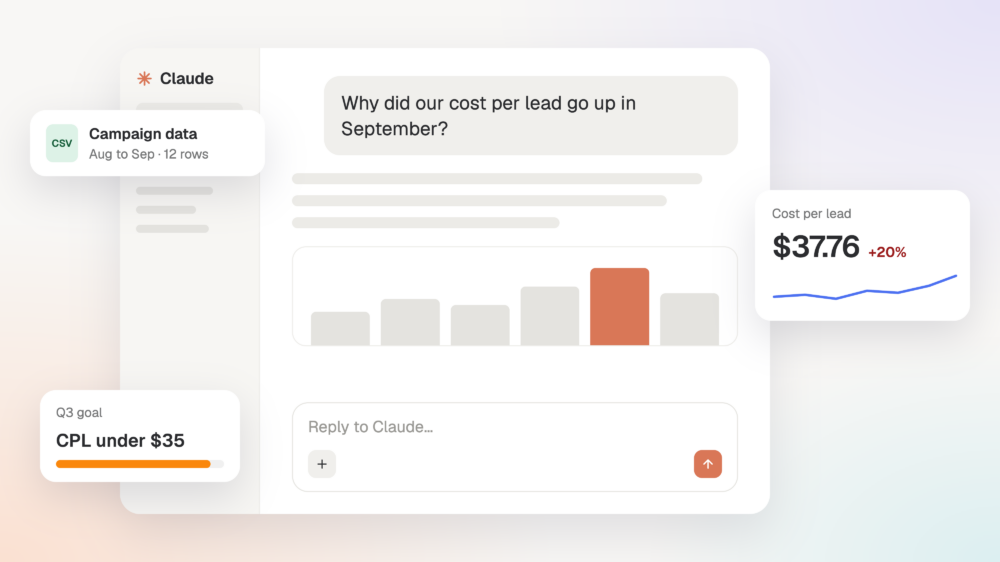
- Analyze spending and forecast future costs. Ask the AI Analyst what’s driving increases in spending, which workspaces or models contribute most, and how much you’re likely to spend by the end of the month.
- Get alerted before spending exceeds your budget. Set up alerts when Claude costs approach a budget threshold or increase unexpectedly, so you can investigate and take action before costs get out of hand.
- Automate recurring analysis and reporting. Use Routines to have the AI Analyst review Claude usage and spending every week, identify significant changes, and send a summary to your team by email or Slack.
- Turn your data into reports and presentations. Create reports or slide decks with your latest Claude spending, usage trends, and key findings to share during leadership reviews.
Tracking Claude usage in the Claude Console vs. Databox
The Claude Console already lets you monitor usage and costs, and remains the source of truth for your Anthropic billing. Databox builds on that data, making it easier to monitor spending across teams, analyze trends, and include AI costs in your broader business reporting.
| Claude Console | Databox | |
|---|---|---|
| Usage and costs | Separate usage and cost reports | Usage, costs, and trends in one customizable dashboard |
| Data access | Users with the required Console permissions | Share dashboards with finance, IT, and leadership |
| Other business data | Focused on Claude usage and costs | Combine Claude with data from 130+ other sources |
| Analysis and forecasting | Native charts, filters, and analytics | AI Analyst to investigate changes and forecast future costs |
| Spending alerts | Native spending limits and notifications | Custom budget thresholds and alerts for unexpected changes |
| Reporting | Console reports | Automatically updated dashboards, reports, and scheduled AI analysis |
| Setup | Available in the Console | Requires a custom integration |
Start tracking Claude usage and costs with Databox
As more teams use Claude, keeping track of usage and spending shouldn’t mean pulling together spreadsheets every month.
With Databox, you can bring Claude data into one dashboard, monitor AI spending alongside your other business metrics, and automate reporting so everyone has access to the latest numbers.
Want to see how this could work for your organization? Book a call with our team to explore how you can bring your AI usage, costs, and other business data together in Databox.
Frequently asked questions
What is a Claude usage dashboard?
A Claude usage dashboard shows how much your organization spends on Claude and how it’s being used, including total spend, input and output tokens, costs by workspace and model, and how those numbers change over time. In Databox, it updates automatically, so you don’t need to export reports from the Claude Console.
How do I connect Claude to Databox?
Databox doesn’t have a native Claude integration, so you build one with the no-code Custom Integration Builder. You only need an Admin API key from your Claude Console to authenticate the connection. Then you choose the data to bring in, such as date, workspace, model, and cost.
Can I track Claude costs by team?
Yes, if each team or department uses its own Claude workspace. Databox breaks spending down by workspace, so you can compare costs across teams and see which ones drive the most usage.
Can I track Claude Code usage and costs?
Yes. If your development teams use Claude Code, you can monitor developer activity, sessions, token usage, and estimated costs in the same dashboard as the rest of your Claude spending.
How often does my Claude data update in Databox?
Databox syncs your Claude data on the schedule you choose, so your dashboards and analyses stay up to date without manual exports.
Can I get alerted when Claude spending goes over budget?
Yes. You can set alerts for when Claude costs approach a budget threshold or increase unexpectedly, so you can investigate before costs get out of hand. You can also use Routines to have the AI Analyst review your spending every week and send a summary to your team by email or Slack.
Do I still need the Claude Console if I use Databox?
Yes. The Claude Console remains the source of truth for your Anthropic billing. Databox builds on that data, so you can share it with more people, analyze trends, and report on AI costs alongside your other business metrics.