

Describe the metrics in plain English. AI Analyst builds them, assembles the dashboard, and next month’s report starts from this month’s build.
To build a marketing dashboard in one conversation, describe each metric you need to AI Analyst inside Databox in plain English, confirm the components it proposes, and ask for a dashboard assembled from the metrics you defined. Emil Korpar, Director of Customer Success at Databox, demonstrated the full build in a recent webinar, from a blank slate to a shareable dashboard, and this article walks through it step by step.
TL;DR
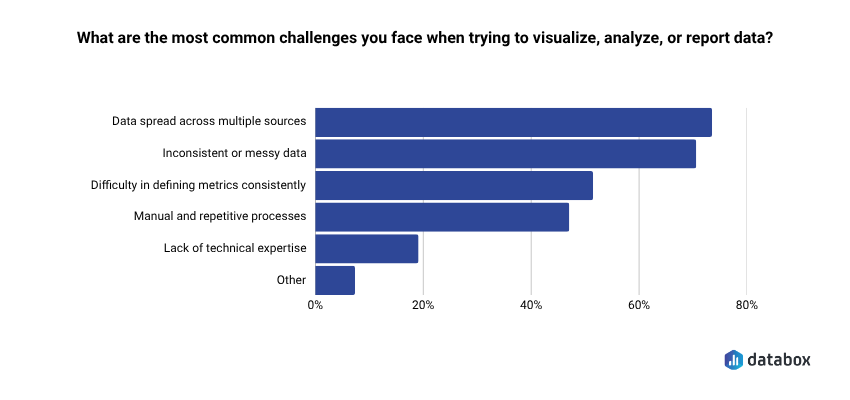
- In Databox’s Time to Insight: What Are the Biggest Roadblocks to Actionable Data? survey, 73% of teams named data spread across multiple sources as their top challenge when visualizing, analyzing, or reporting data. Blended metrics like cost per lead across ad platforms are exactly the numbers that fragmentation makes expensive to build by hand.
- Describe each metric fully in plain English: the calculation, the channels it draws from, and the time window. AI Analyst proposes the component metrics, shows its formula, and builds everything on one confirmation.
- The metrics come first and the dashboard comes last. Emil built blended CPL, blended ROAS, and spend by channel as reusable metrics, then prompted one dashboard assembled from them, edited it directly, and shared it.
- Agencies copy the finished dashboard into any client account, save it as a template, and roll performance up across selected client accounts in a single report. Cross-client rollup requires the Agency plan.
- AI Analyst is included in all Databox plans.
The routine Emil opened with is one most marketers could recite from memory. You export data from Google Ads, Meta, and LinkedIn, drop everything into a spreadsheet, and spend the next hour getting three exports to agree with each other. By the time the dashboard is presentable, the numbers are days stale. If you report across several clients or teams, the routine repeats every single cycle.
Each ad platform reports happily on itself. The comparison across platforms only exists once someone builds it, and that someone has always been you. In Databox’s Time to Insight: What Are the Biggest Roadblocks to Actionable Data? survey, 73% of teams named data spread across multiple sources as their top challenge when visualizing, analyzing, or reporting data. The most useful marketing numbers, blended cost per lead, blended ROAS, total spend across channels, are precisely the ones fragmentation makes expensive.
Emil’s demo replaced all of that with a chat. You tell Databox’s AI Analyst which metrics you need, in plain English. It pulls them from the sources you have already connected, calculates the blended numbers, and builds the dashboard. The manual blending work goes away. Deciding what the blended number means is still your job.
Describe the metric before you ask for the dashboard
The order is the technique. Emil built three metrics before he asked for anything visual, because the metric is the reusable unit in Databox and the dashboard is only one place it lands.
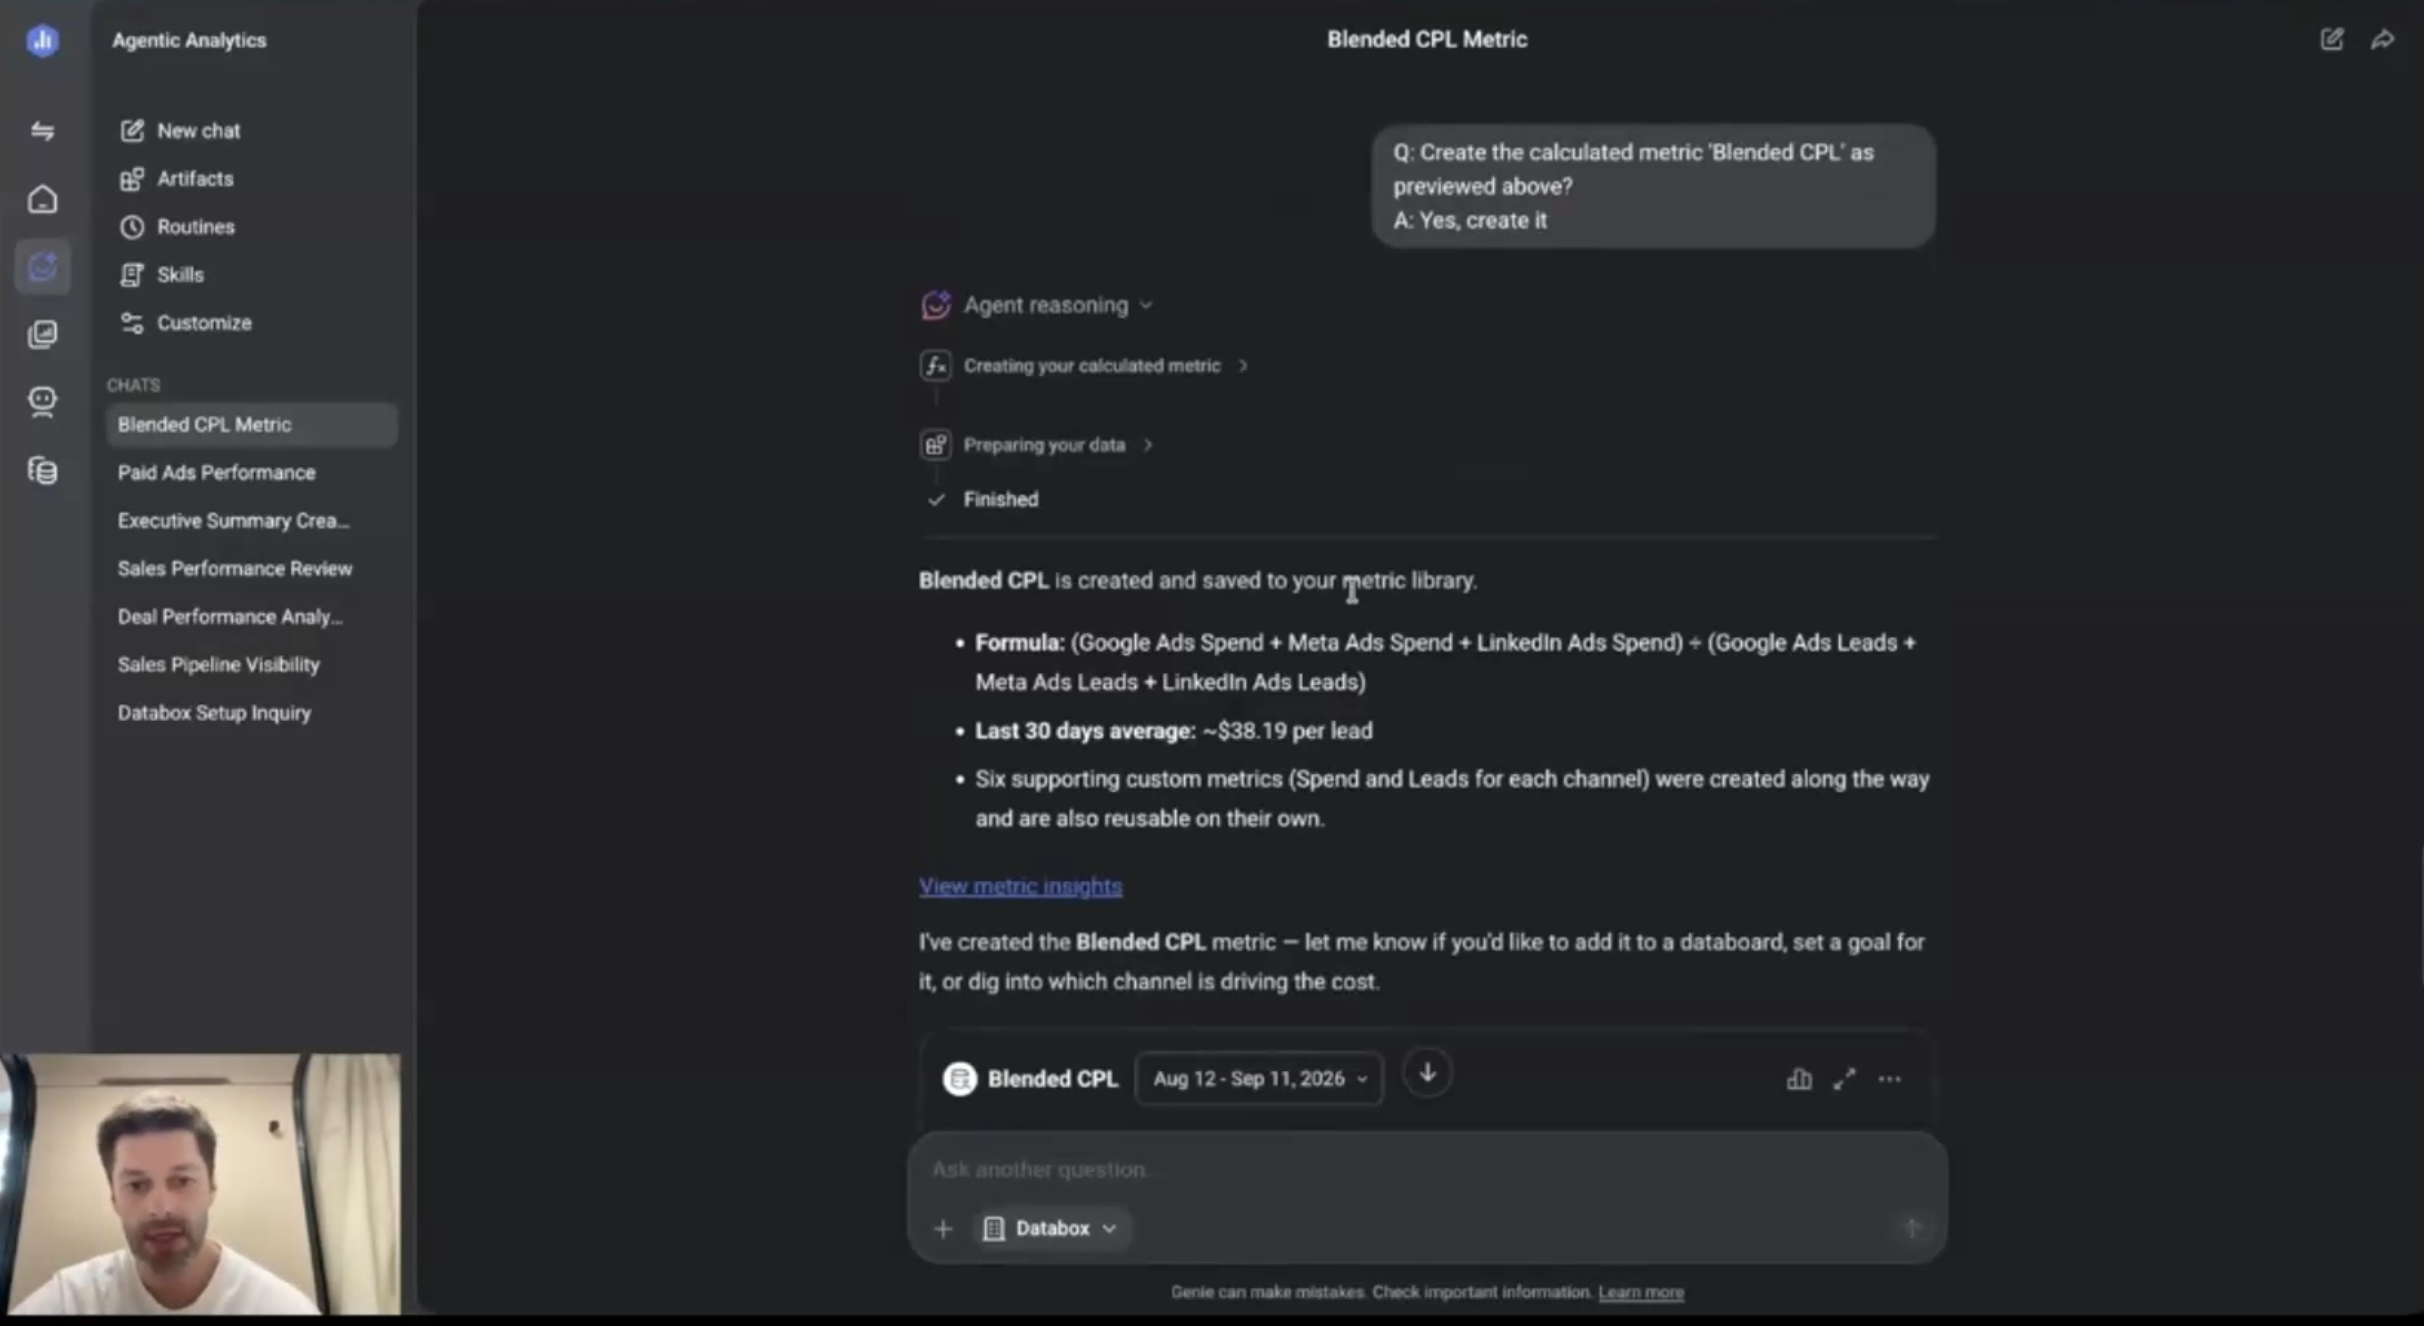
Emil’s first prompt was to create rather than to ask: create a metric called blended CPL that divides total spend across Google Ads, Meta Ads, and LinkedIn Ads by total leads generated from those same channels over the last 30 days.
The AI Analyst came back with a plan before it built anything: six component metrics, spend and leads for each channel, plus the blended CPL calculation on top. One confirmation and all of them existed in the account.
AI Analyst shows its math before it commits
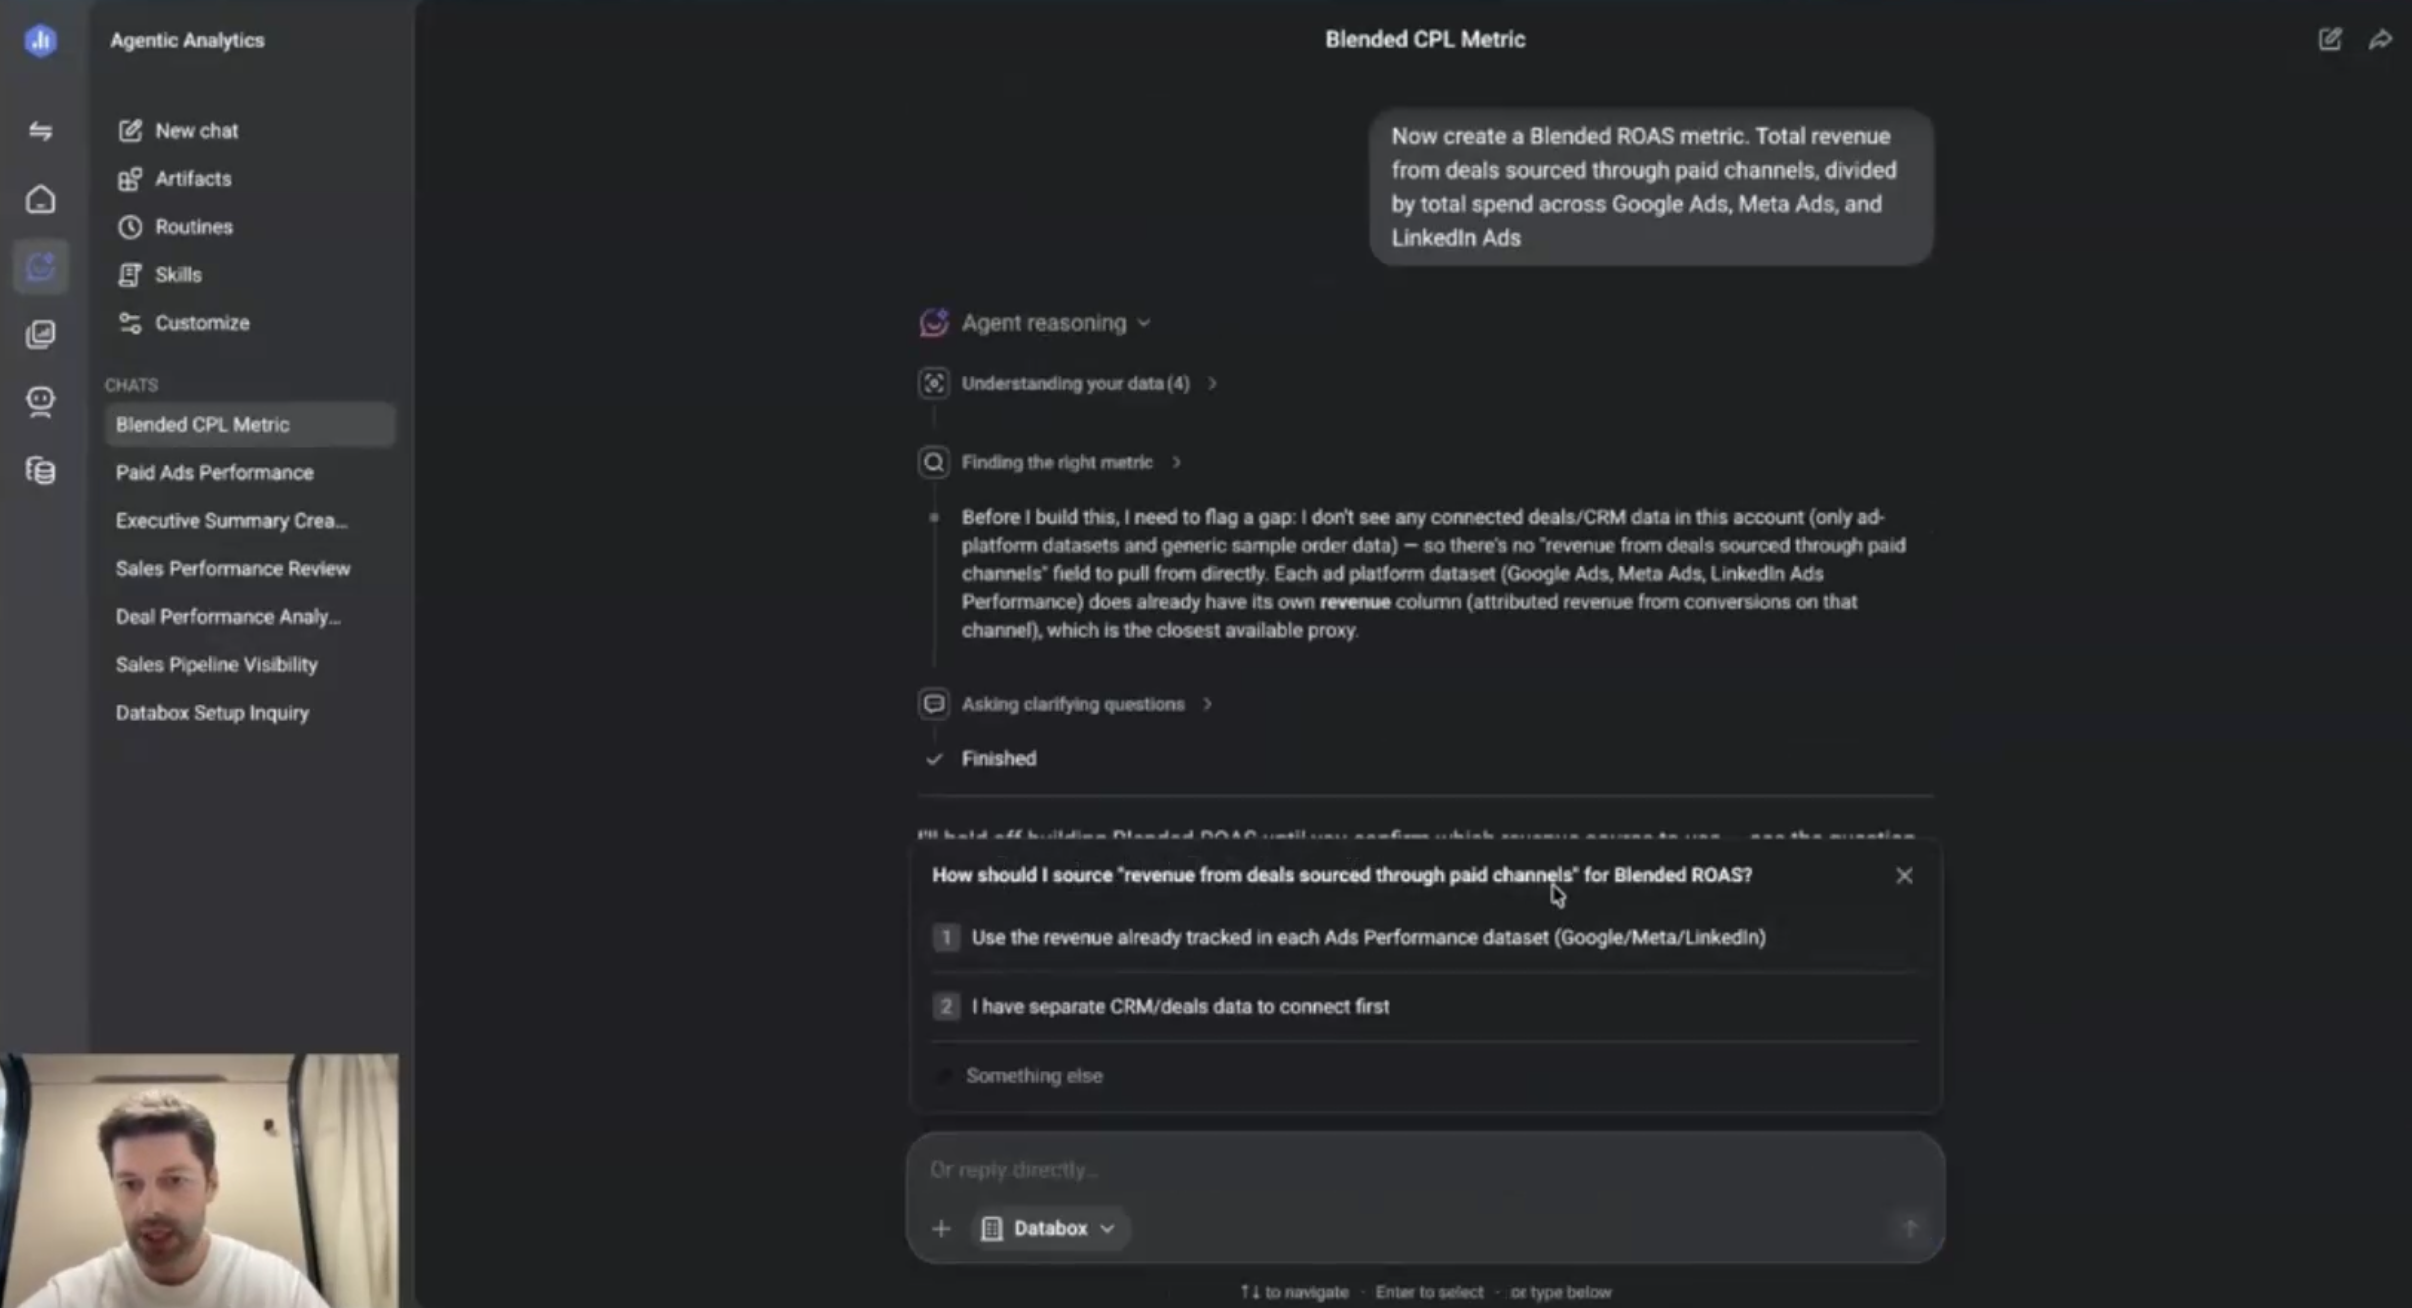
The second metric surfaced the behavior that makes the workflow trustworthy. Emil asked for blended ROAS, total revenue from deals sourced through paid channels divided by total spend across the same three ad platforms.
Before creating the metric, the AI Analyst previewed the formula it intended to use and the numbers it produced. Emil validated both, then confirmed. Ambiguity gets surfaced as a question, and the math gets shown before it lands in your account. Both habits matter more than speed when the number is headed to a client.
One prompt assembles the dashboard, and it outlives the chat
With blended CPL, blended ROAS, and a third metric for total ad spend by channel created, Emil closed the AI Analyst’s own offer to build a dashboard because he wanted to give it fuller instructions. His prompt was: build me a marketing performance dashboard using blended CPL, blended ROAS, and total ad spend by channel, compared to last month.
The dashboard that came back is live, and everything on it stays editable. Emil switched a number chart to a bar chart, changed the granularity from daily to the last four weeks, and toggled value labels, all without touching the chat again. Sharing works the way any dashboard shares: with your team, your leadership, or the clients you manage – via link, email, etc.
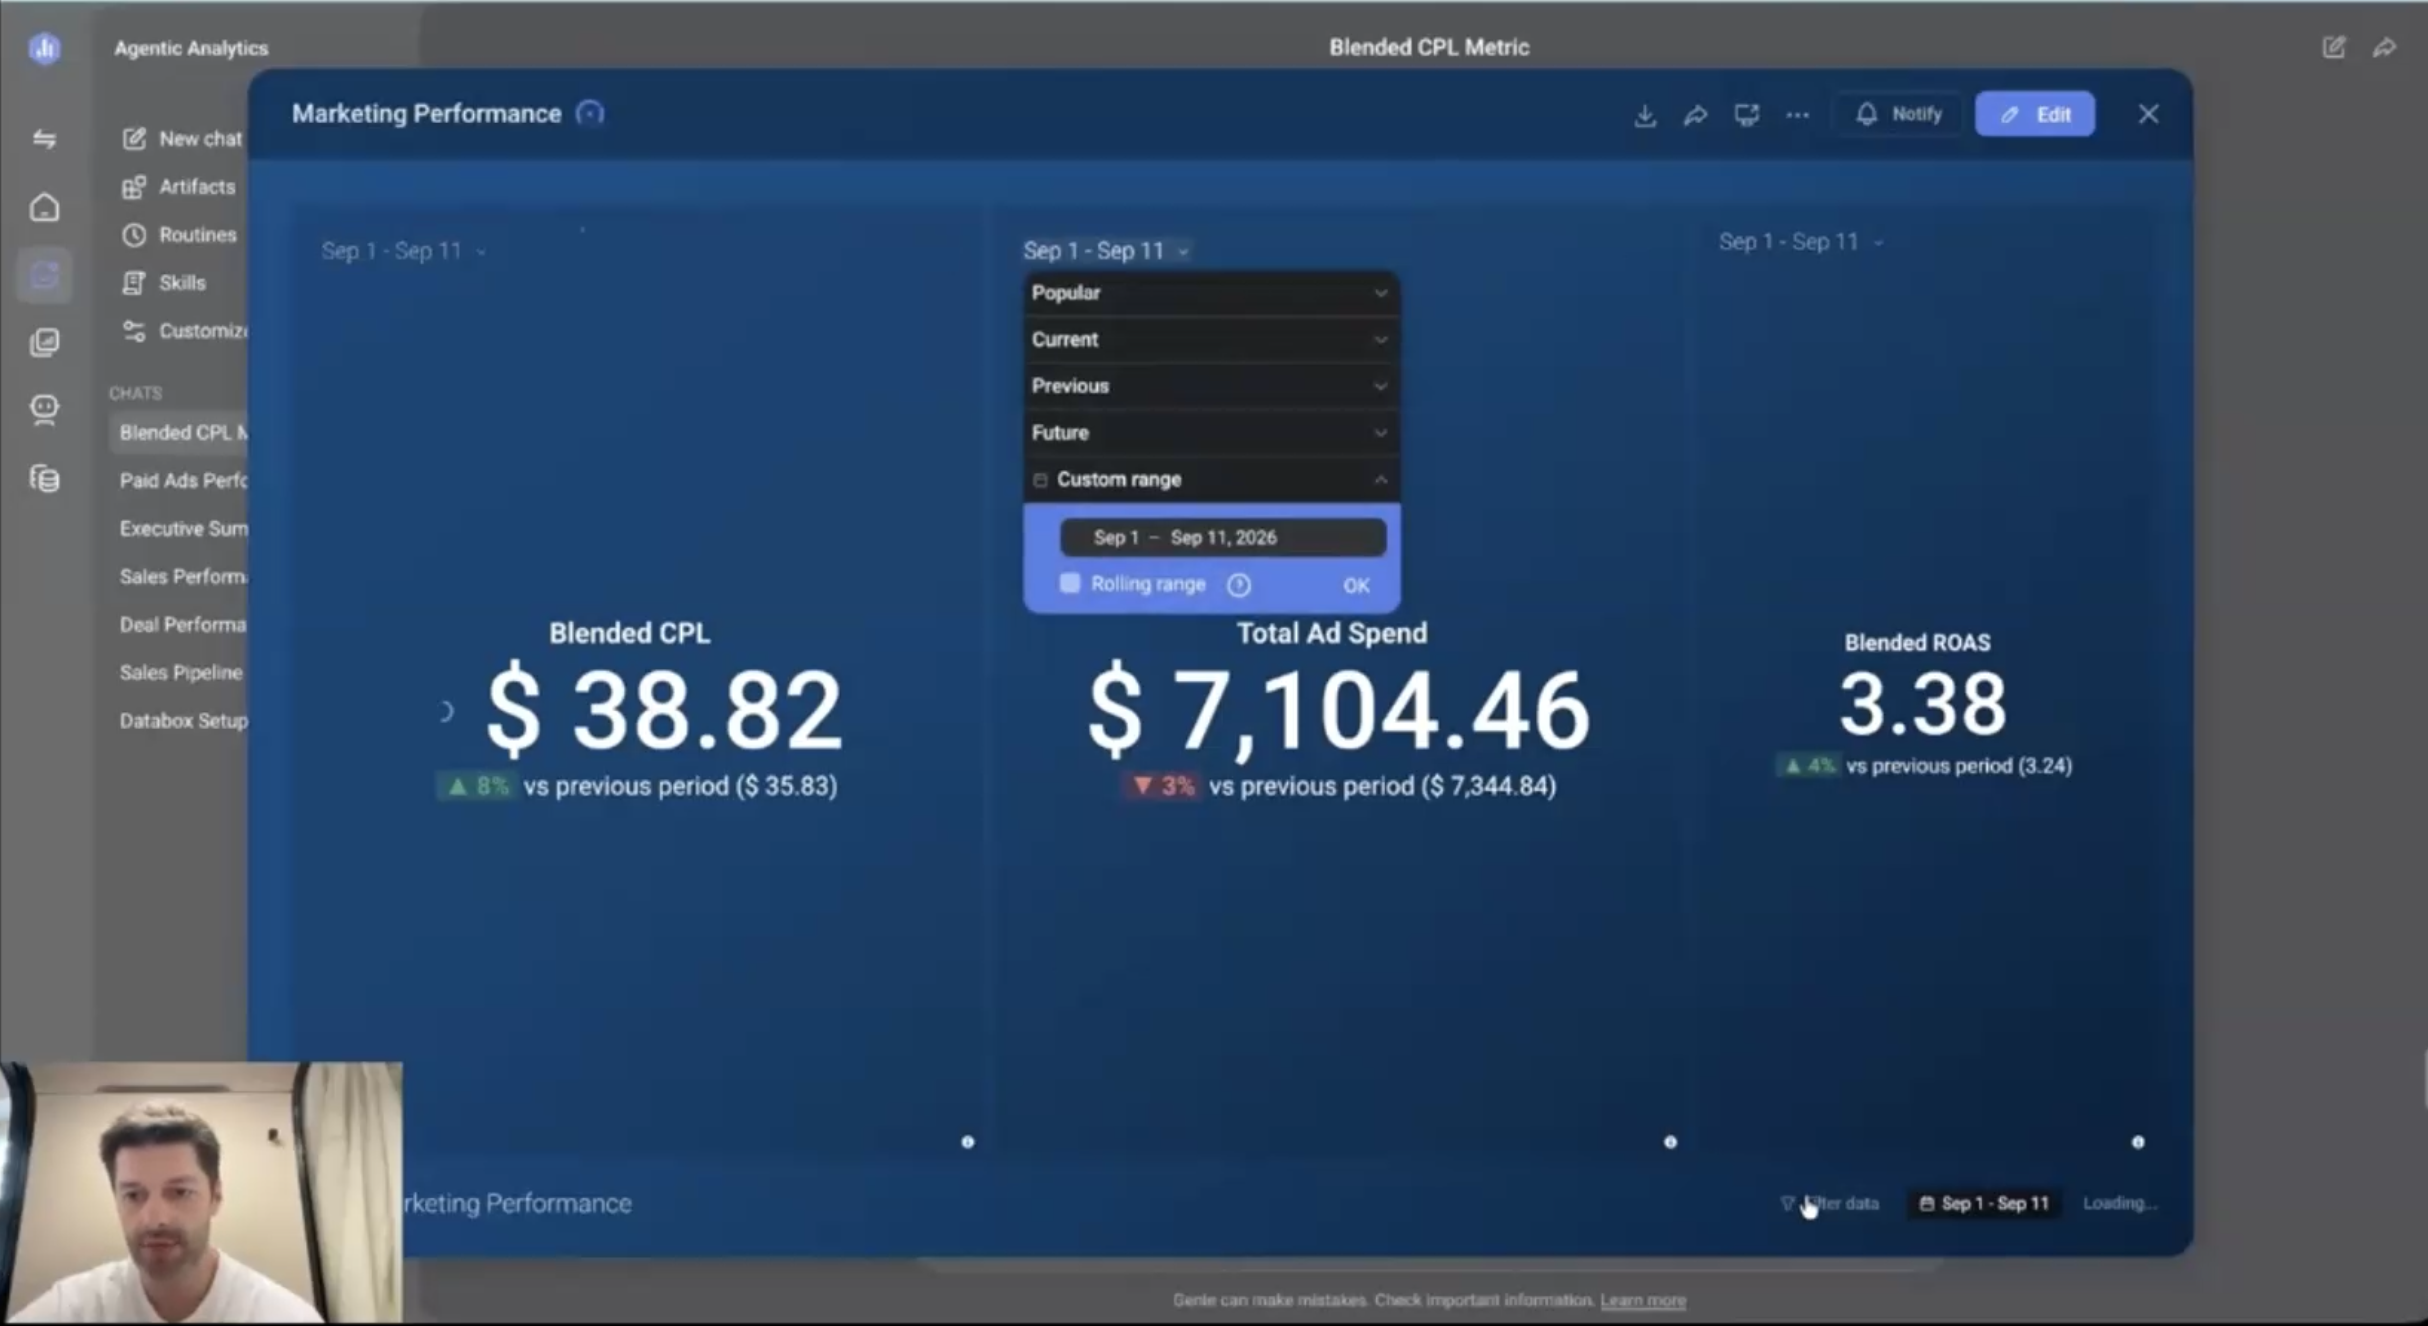
It also survives the conversation. The dashboard sits under Databoards in the account and refreshes with new data, so next month’s report starts from this month’s build. Anything you want changed from there, you edit directly or prompt AI Analyst to add.
Agencies carry the same build across every client
Everything above happened inside one account. The back third of the demo addressed the people managing many.
A finished dashboard copies straight into any client account from its menu, and saving it as a template makes the reuse repeatable, so the metrics get defined once and every client gets the same layout. An attendee asked in the Q&A whether agencies rebuild per client, and the answer was a flat no.
The rollup goes further. Emil selected three client accounts below the chat box, which scopes AI Analyst to their data, and prompted a rollup report showing total ad spend, leads, and cost per lead across all selected accounts for the last 30 days. The client accounts only had Google Ads connected, and AI Analyst flagged the gap and asked how to proceed before building anything. It also packaged the result as an artifact without being asked, because a rollup is a report built for sharing. The artifact refreshes when you ask it to, so a single prompt before the Monday meeting brings it current.
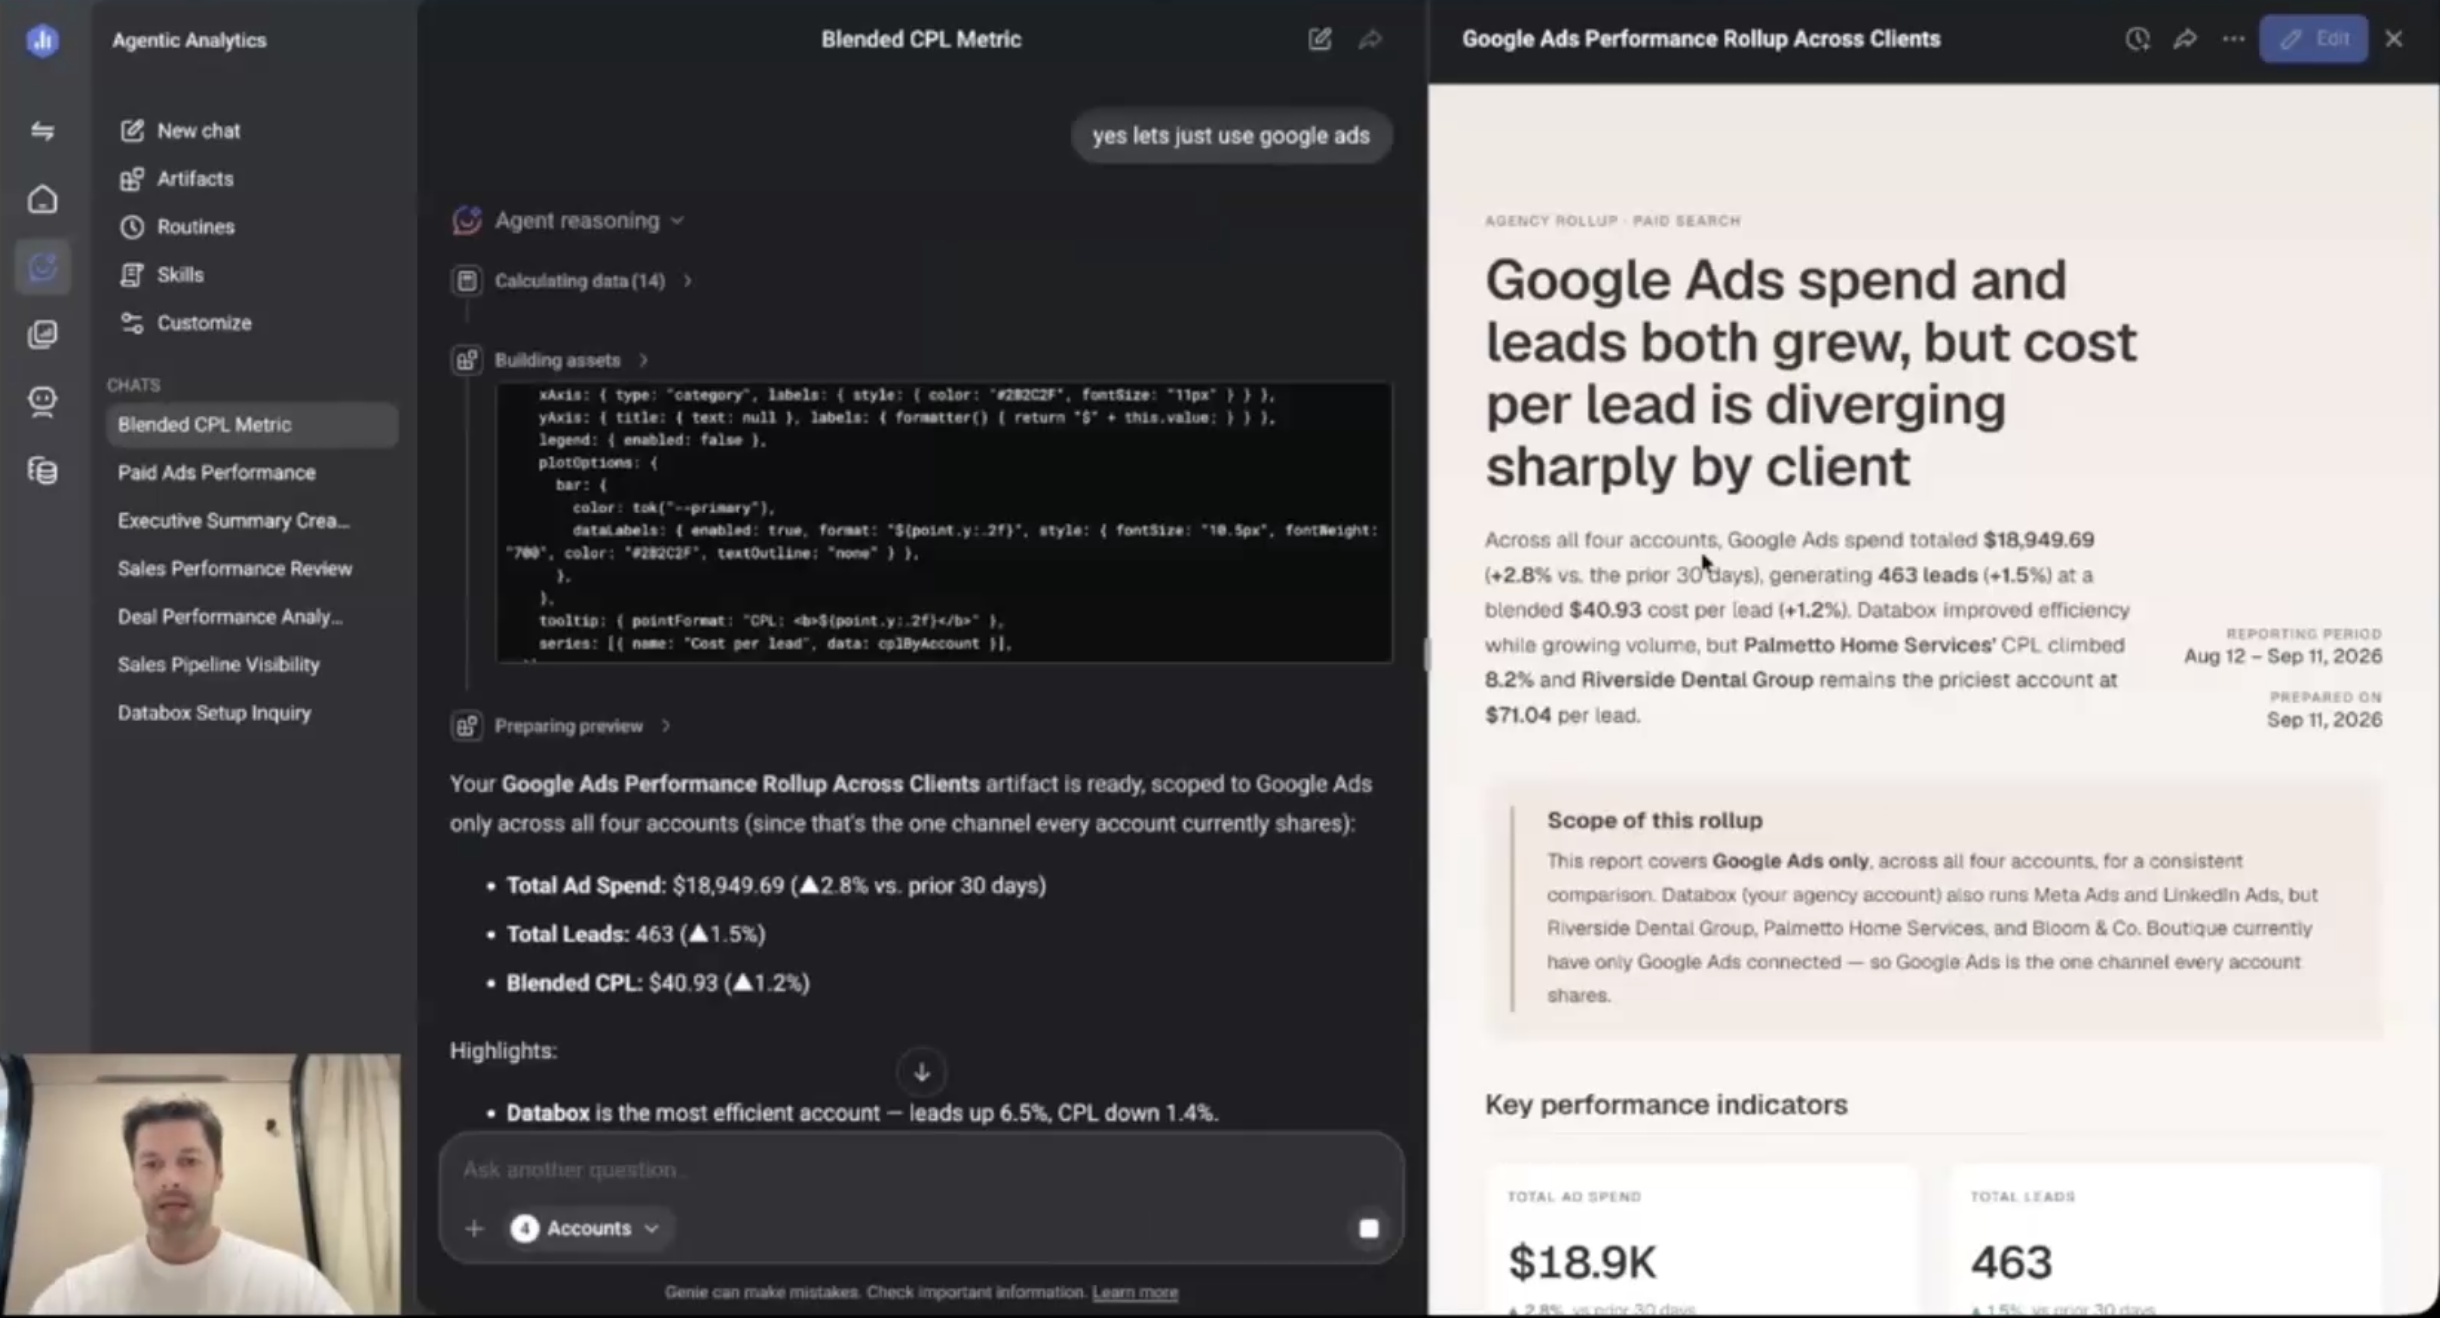
Cross-client rollup is available on the Databox Agency plan, and it assumes an agency-style structure: an admin account with client accounts underneath, whether those are clients, locations, or stores.
The assembly was the grind, and the assembly is what’s gone
The export, the blending, the reconciling by hand: all of it existed because the comparison across platforms had to be built by someone. That work now fits in one conversation. The part of the job that was always human, reading the finished picture and deciding what to do about it, gets the hours back now.
FAQ
Frequently asked questions
Can AI Analyst create calculated metrics?
Yes. Describe the calculation in plain language and it builds the component metrics and the formula on top. Existing calculated metrics can also be nested inside new ones, which covers advanced ratio-style calculations that combine several formulas.
Do agencies have to rebuild the metrics for each client?
No. Build the metrics once, place them on a dashboard, and copy that dashboard into any client account, or save it as a template for repeatable reuse across accounts.
Is the cross-client rollup only for agencies?
It requires the Databox Agency plan and an agency-style account structure: an admin account with client accounts underneath. Multiple locations or stores set up as individual accounts fit the same structure.
Can AI Analyst update an existing dashboard instead of building a new one?
It can add new metrics and blocks to an existing dashboard, and it can replace a block to show the same metric in a new visualization. Direct edits to existing blocks stay manual for now.
Does AI Analyst help connect data sources?
Yes. It can prompt you to connect a source from inside the chat, so a missing connection gets fixed without leaving the conversation for the data manager page.
Is AI Analyst included in Databox plans?
Yes, AI Analyst is included in all Databox plans. Cross-client rollup requires the Agency plan.