
Data Analytics Tool
Analyze easier, and get from question to answer to insights faster
Spot trends, explore patterns, and uncover insights your team can act on, faster.








Surface insights that guide action
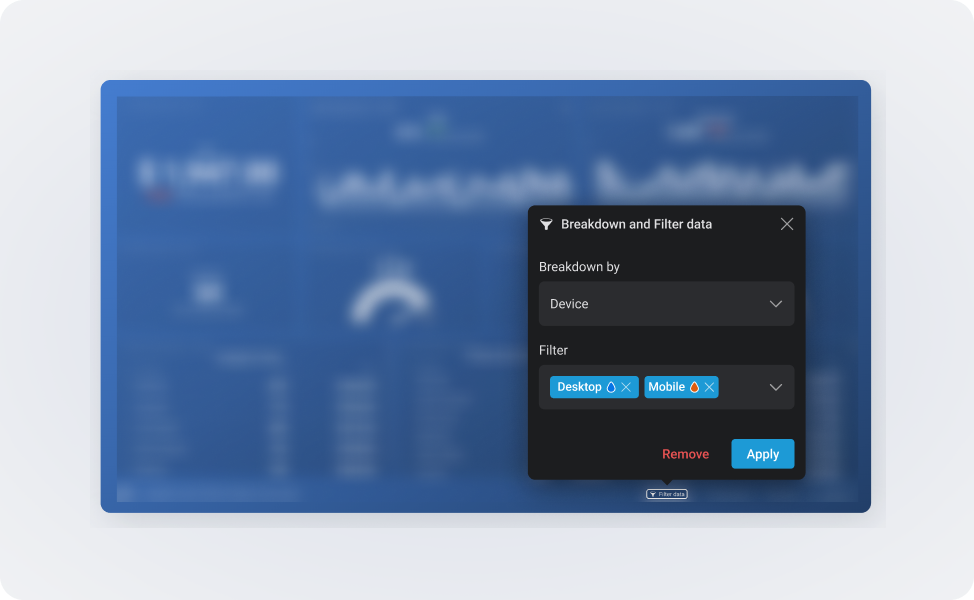
Analyze performance across segments
Break down and filter entire dashboards, or the metrics on them, by different dimensions.
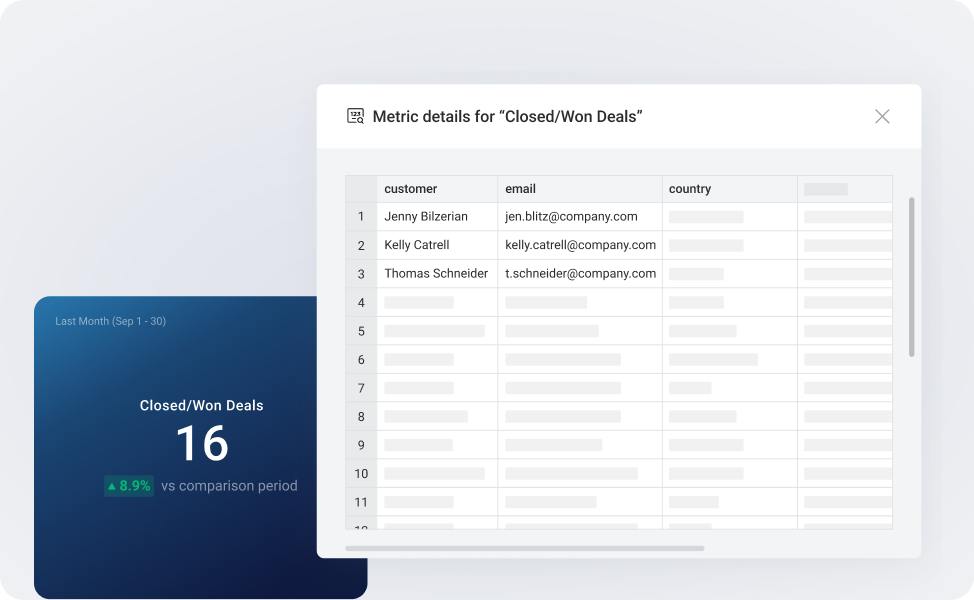
See what’s driving your metric
Click a metric on a dashboard to drill down into the row-level data behind it.
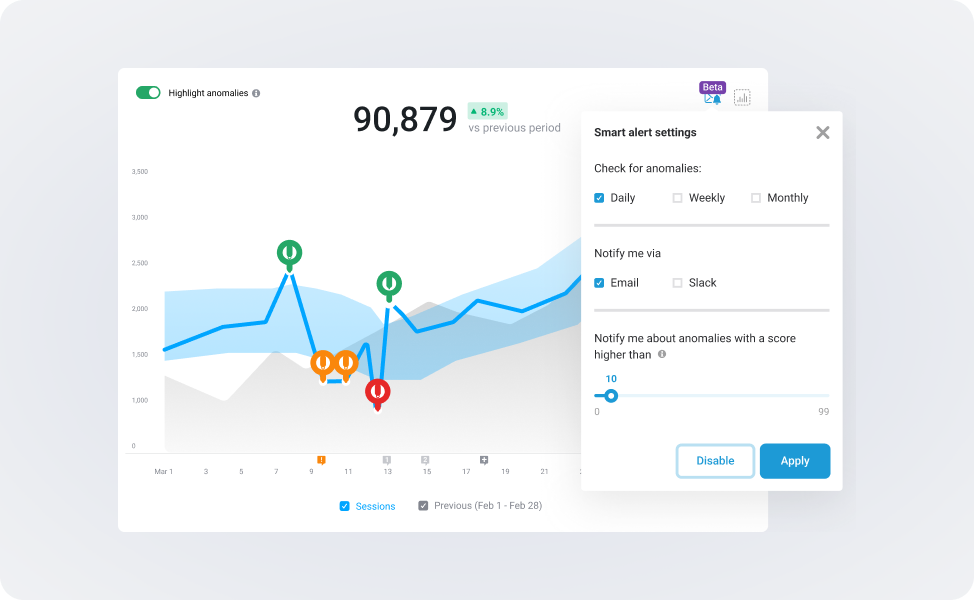
Spot anomalies earlier
See when performance deviates from typical patterns, so you can respond quickly and keep things on track.
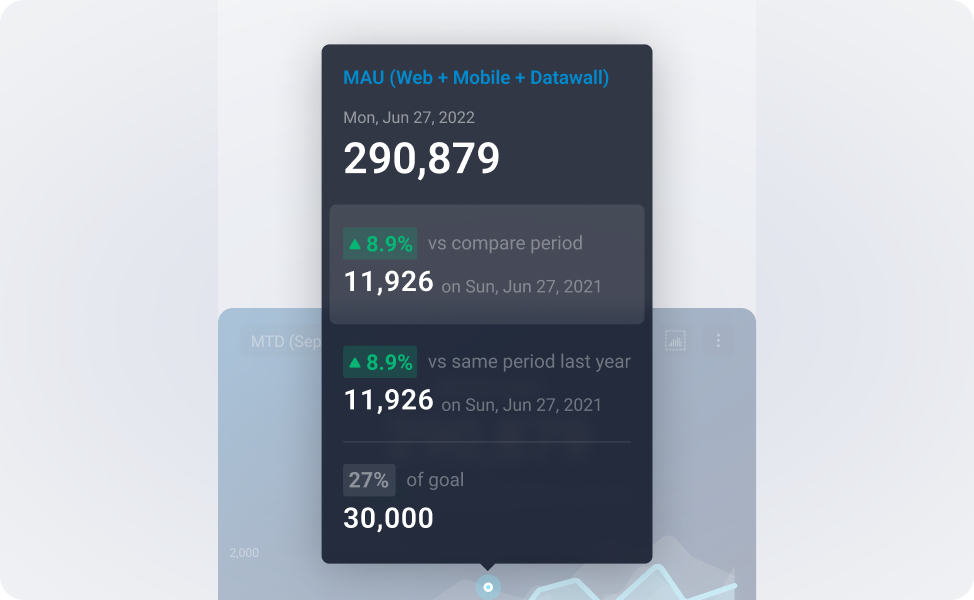
Compare performance over time
Add historical comparisons to your dashboards to surface trends and understand how performance has changed over time.
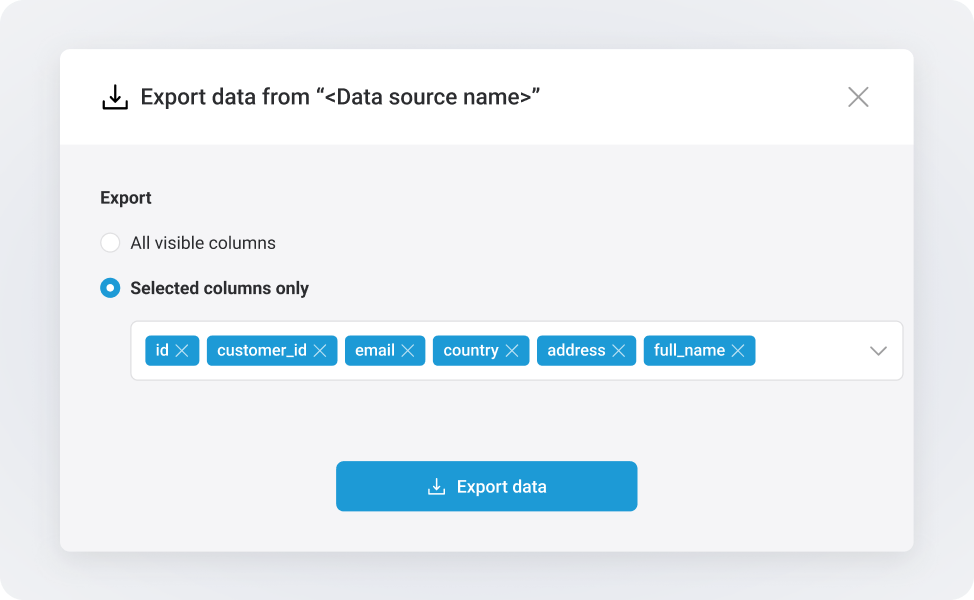
Export to CSV
Prepare your data in Databox, then export it for analysis in other tools.
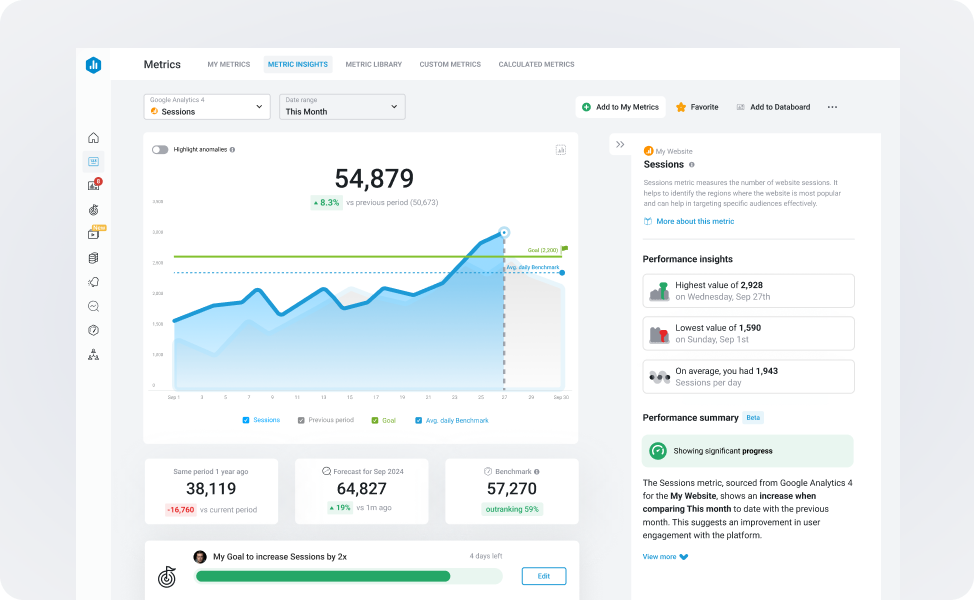
Dig deeper into a specific metric
Visualize a metric’s performance, uncover anomalies, view forecasted performance, and compare to benchmarks – from one view.
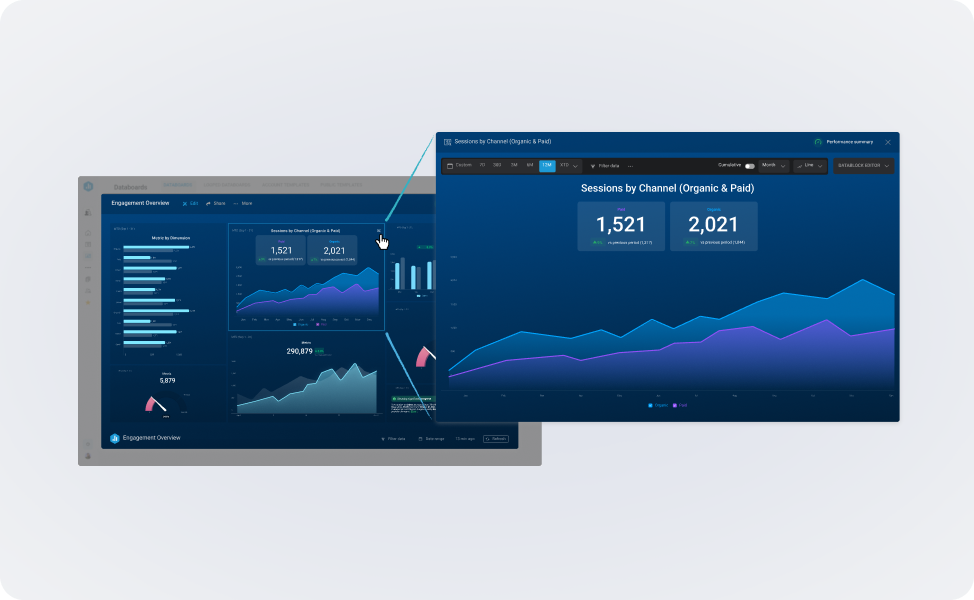
Explore your data directly from your dashboards
Expand any metric on your dashboard to compare trends, filter by dimension, and switch visualizations to spot what’s driving changes to your performance.


Frequently asked questions
What makes Databox different from other analytics or BI tools?
Databox is designed for anyone, not just analysts. It combines the power of BI tools with the simplicity and speed that growing teams need.
Here’s what sets it apart:
- Drill into any metric to view the row-level data behind it
- Filter entire dashboards by campaign, country, device, or any other dimension with a single click.
- Generate AI-powered Performance Summaries that explain key trends and changes
- Get alerted to issues early with built-in anomaly detection and Smart Alerts.
Databox makes advanced analytics accessible, so your whole team can move faster, with more confidence.
Do I need analytics expertise to use Databox’s analysis features?
Not at all. Databox is built so anyone, regardless of data background, can explore and understand performance with confidence.
With one-click filtering, row-level drilldowns, and flexible visualizations, it’s easy to explore what’s driving performance.
Can I set up alerts to flag significant changes in performance?
Yes. Databox makes it easy to stay informed when performance shifts.
You can create alerts based on:
- Specific values (e.g., “Sessions drop below 1,000”)
- Percentage changes (e.g., “Leads decrease by more than 10%”)
- Goal progress (e.g., “We’re 75% to goal”)
You can also enable Smart Alerts on key metrics to automatically detect and notify you of unusual spikes or dips in your data.
Can I compare performance across different time periods?
Yes. You can compare any metric to previous periods, the same period last year, rolling averages, goals, or custom ranges.
How do I know if my performance is good or bad?
Databox gives you built-in context to help you evaluate your performance:
- Benchmarks that show how your metrics compare to similar companies filtered by industry, size, and other factors.
- Goals track whether you’re ahead, behind, or on pace to hit targets.
- Trends & historical data help you spot improvement or decline over time, so you can evaluate progress.
How does Databox keep my data secure?
Databox runs on secure AWS infrastructure. All data is encrypted in transit (TLS 1.2+) and at rest (AES‑256), with encryption keys managed through AWS Key Management Service (KMS).
We also conduct annual penetration tests, run regular vulnerability scans, and follow ISO 27001-aligned security controls and disaster recovery procedures. Databox is SOC 2 certified.