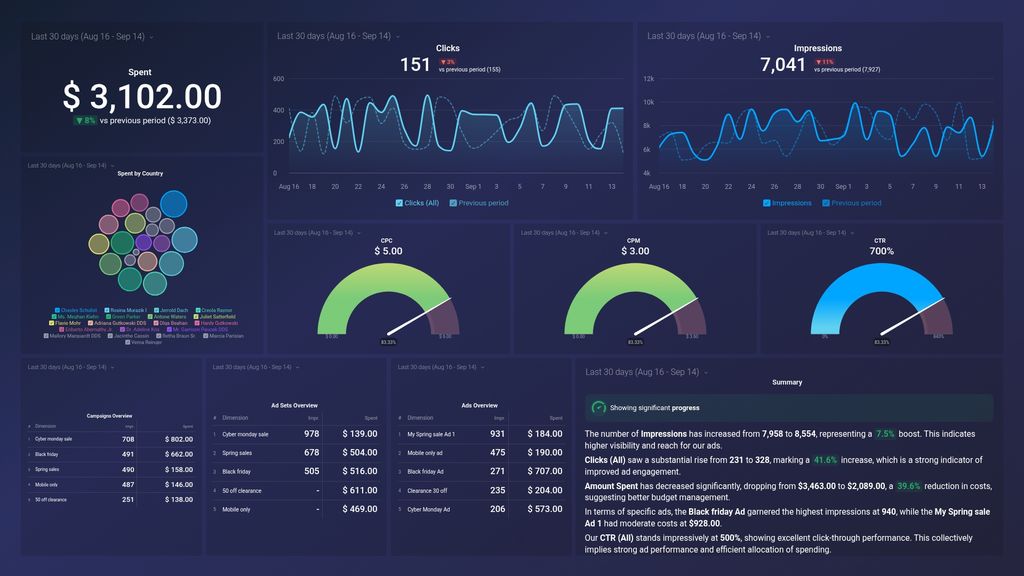
What you can learn from this Facebook Ads Campaign Report Dashboard Template
With this Facebook Ads campaign report for performance template, you’ll be able to discover your most popular ads and see which campaigns have the highest ROI. No more guessing which campaigns need adjustments––simply connect your Facebook Ads account and you’ll learn:
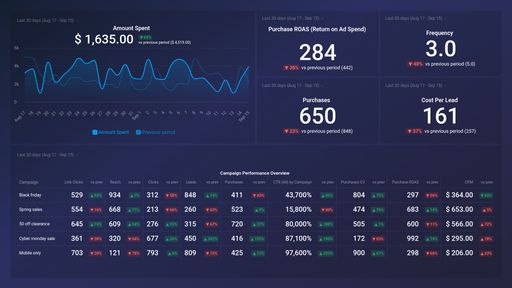
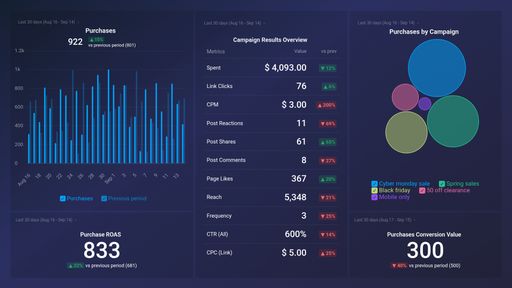
- How are my ad campaigns trending on a daily basis? Track the number of engagements your campaigns receive on a daily basis to ensure you’re on track for hitting your goals and improving over time.
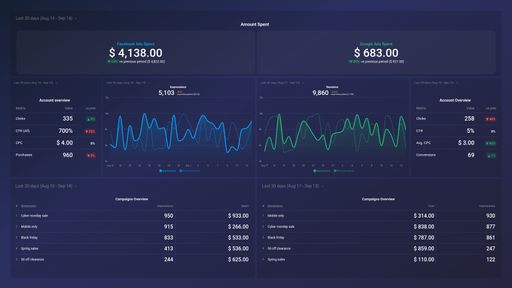
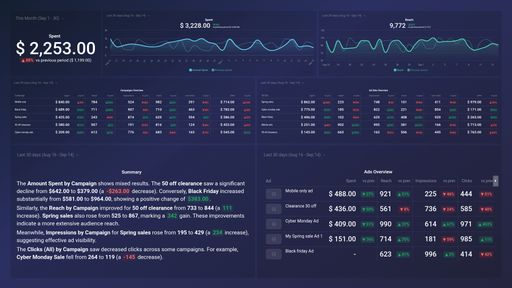
- What are our highest performance Facebook Ad campaigns? Which campaigns receive the most impressions? Which have a lower cost per click? Measure and compare campaigns so you can make adjustments accordingly.
- How many clicks do our ads receive? Measure the total number of ad clicks your campaigns are receiving over a given time period and have a better understanding of the content that resonates best with your audience.
- Are our ad campaigns under or over budget? Easily keep every campaign within budget by monitoring the amount you’ve spent over any given time period. Compare the amount you’re spending to previous periods to measure the growth and efficiency of your program.
- What are our most cost-efficient ad campaigns? Quickly identify which ad campaigns are driving results at a lower price. This way, you can reallocate budget to your most cost-efficient ad campaigns.
- How often are people seeing our ads in their news feed? Measure the overall frequency and impressions of your ad campaigns. Compare what you're seeing to previous time periods and track whether your reach is improving with time, and if not, how you can make adjustments to improve it.
Pull additional data using our deep integration with Facebook Ads.
What other campaign metrics can you track and visualize with our integration with Facebook Ads? Almost anything:
- Individual campaign and ad performance
- Clicks, downloads, leads, and sales
- Cost per impression (CPM), click (CPC), and lead (CPL)
- Return on ad spend (ROAS)
- Ad spend and overall budget
- Progress towards your campaign goals, and more
In Databox there are almost 100 Facebook Ads metrics already built and ready for you to visualize in a variety of different ways. With the use of Query Builder and Data Calculations, the range of different metrics and metric combinations you can track from Facebook Ads widens.
Read more about Databox’s Facebook Ads integration.