I spent years building dashboards that nobody used.
Not because they were bad dashboards — they were actually pretty good. Clean visualizations, real-time data, all the metrics leadership said they wanted. But here’s what I learned: the problem was never the dashboard. The problem was the gap between seeing what happened and doing something about it.
You look at a dashboard. It doesn’t act. When ROAS drops below the threshold at 11pm on a Tuesday, the dashboard records the fact faithfully. You find out Wednesday morning, investigate for an hour, and take action by noon. The damage is already done.
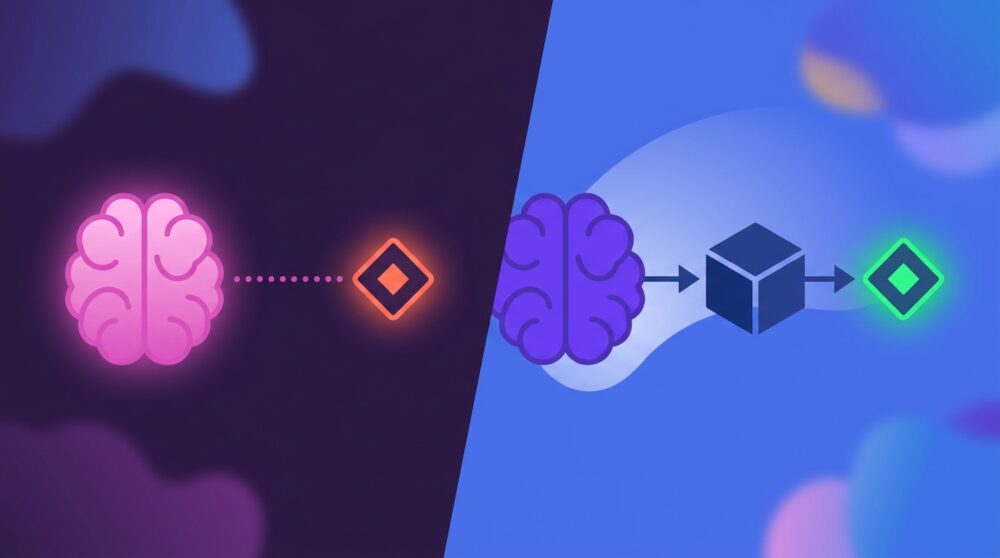
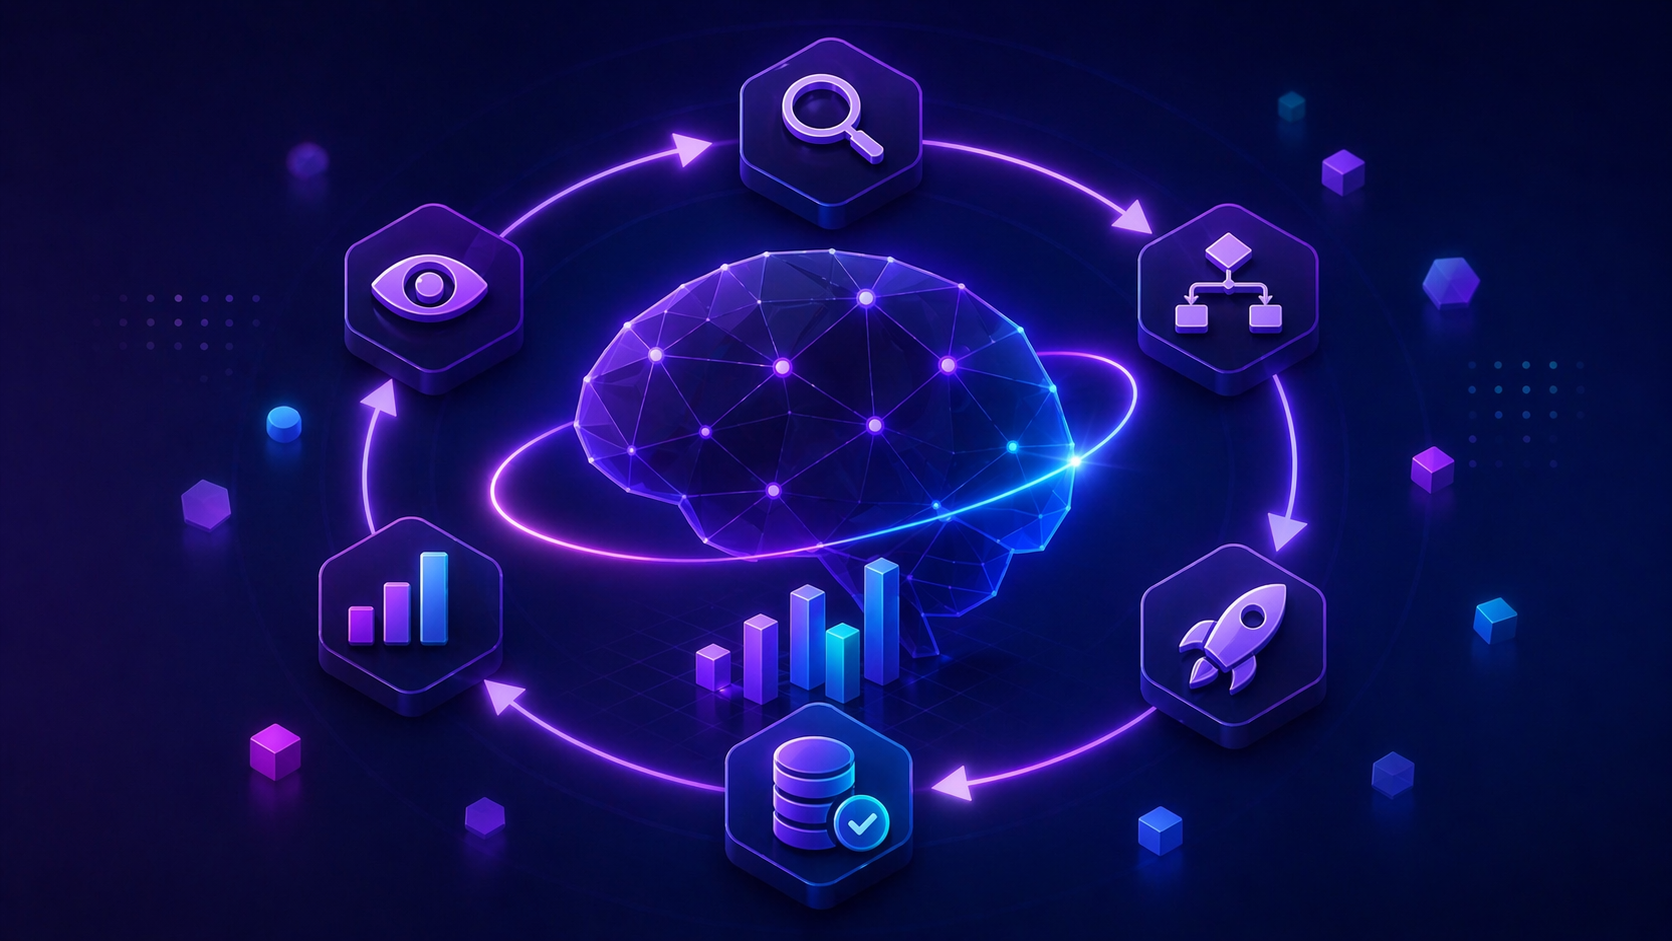
That gap between insight and action is exactly what agentic analytics closes. Not by giving you faster dashboards or smarter reports — but by deploying AI agents that complete the full loop: observe the data, orient to what it means, decide what to do, act on it, and record the result. No human in the middle for the decisions that don’t require one.
I’ve been building these systems with Databox’s MCP implementation for the past several months. Here’s what they look like in practice.
TL;DR
- Agentic analytics workflows monitor data on a schedule, detect changes, decide within rules you define, act through connected tools, and log what they did. A person sets the boundaries and reviews the log.
- The enabler is an MCP connection that can query and ingest. Query lets an AI answer questions from live data. Ingest lets it write results back, which is what turns a question-answering setup into one that keeps a record.
- The OODA loop (Observe, Orient, Decide, Act, Record) is the operating model. Traditional BI stops at Observe. The workflows below run the rest.
- Trust depends on architecture. Agents that compute answers from LLM reasoning hallucinate. Agents that query live governed data and generate language around the result do not. Settle this before you deploy anything.
- The practical starting point is finding which recurring decisions in your analytics workflow are rule-based enough to delegate, then automating those first.
How I use the term in this article
Most vendor definitions describe what agentic analytics will eventually become. This article uses the working version: AI agents that run the observe, orient, decide, act, record cycle against live data, on a schedule, inside boundaries a person sets. Dashboards answer what happened. Conversational tools answer when asked. The workflows below run whether or not anyone asked. For the full definition, the five layers, and how to evaluate a platform, read the agentic analytics pillar. The rest of this article shows the workflows.
Why an MCP that can query and ingest makes these workflows possible
If you have been in marketing or analytics for a while, you are skeptical. Every few years someone promises AI that acts on your data, and it turns out to mean a slightly better notification email.
Here is the specific technical reason this time is different, and the detail most vendors do not explain clearly.
Before MCP (Model Context Protocol), connecting an AI agent to your business data required custom API integrations for every tool and every data source. Someone had to write code, maintain it, and update it every time an API changed. Most teams could not justify the engineering investment, so AI stayed disconnected from the data systems where decisions happen.
MCP is an open standard released by Anthropic that lets AI models connect to any compatible data source without custom code. Think of it as a universal connector. If a platform supports MCP, any MCP-compatible AI agent can connect to it. What used to take weeks of engineering now takes about 60 seconds to set up.
The detail that matters for these workflows is what the connection is allowed to do. In my experience, most MCP implementations are query-only. The AI can look at your data and answer questions about it. It cannot write anything back or log what it did. That gives you a more capable question-answering layer. It is still reactive.
Databox’s MCP server does two things. It answers queries against your metrics, and it ingests new data into the system. Ingest is what lets a workflow write its results, and its actions, back into the same place the metrics live.
With a query-only connection, you ask “What was our ROAS last week?” and get an answer.
With query and ingest, an n8n workflow checks ROAS hourly through the MCP, detects when it drops below your threshold, pauses the underperforming campaign through the ad platform’s own integration, and writes the action back into Databox with a timestamp and the reasoning. Databox holds the number and the log. The workflow does the acting, inside rules you wrote.
Once your workflow can write back, you have a record. The loop has an end that feeds the next beginning.
The Agentic OODA Loop: the operating model for AI-driven analytics
Traditional analytics workflows follow a linear path with a human required at every step: something happens, you notice it in a dashboard, you investigate, you decide, you act. Each step requires attention and time. The gap between data and action is measured in hours or days.
With an MCP server that can query and ingest, the workflows run what I call the Agentic OODA Loop:
Observe: The AI monitors a data stream continuously — ad spend, conversion rates, activation rate, pipeline coverage, whatever you define as worth watching.
Orient: The AI analyzes incoming data against baselines and identifies anomalies or threshold breaches based on rules you’ve set.
Decide: Based on those rules, the AI decides whether the situation requires action. This is where human-defined logic governs agent behavior — you control what the agent is authorized to act on.
Act: The AI executes the action: pausing a campaign, sending an alert with context to Slack, adjusting a budget, flagging an anomaly for human review.
Record: The AI ingests the result of its action back into Databox, creating a closed-loop audit trail — what happened, what the agent decided, what it did, and when.
Traditional BI gets stuck at Observe. You can see what’s happening, but everything after that requires a human to initiate the next step. With query and ingest, the rest of the loop runs on the schedule and rules you set.
The practical shift: you go from reactive (“Why did ROAS tank yesterday?”) to proactive (“The agent caught the ROAS drop at 11pm, paused the campaign, and logged the action before you got to your desk”).
This is not hypothetical. It’s the workflow I’ve been running for the past several months.
Why most agentic analytics implementations fail and the one architectural question to ask first
Before showing the use cases, the trust question deserves a direct answer, because Snowplow’s research identified the exact failure mode: “one or two wrong answers and trust collapsed.”
The failure pattern is consistent across implementations that don’t work: the LLM is doing the computation.
When an AI agent reads your data, calculates a result using LLM reasoning, and acts on that calculation, you get hallucination risk at the point of action. The agent pauses a campaign based on a ROAS figure the model generated from pattern-matching rather than retrieved from your actual data. The number was wrong. The action was wrong. You find out later.
The architectural fix is the same one that applies to conversational analytics: the LLM should generate language and decisions, not compute numbers. Computation happens in a separate layer that runs actual queries against live data. The agent acts on retrieved results, not predicted ones.
Ask any vendor: when an agent detects an anomaly and decides to act, is it acting on a queried data result or on an LLM-generated assessment? If the answer isn’t clearly the former, the trust problem is built into the architecture.
The second requirement is governance: what is the agent authorized to act on, and what requires human approval? A well-implemented agentic analytics system has clear action boundaries. Below-threshold ROAS triggers a campaign pause — agent authorized. Budget reallocation above a defined amount — human approval required, agent flags and waits. The audit trail in Databox records both the automated actions and the escalations.
13 agentic analytics workflows running in practice right now
Theory is useful. Concrete examples are more useful. Here’s how agentic analytics actually runs in a real marketing analytics workflow, organized by the type of problem each solves.
Automation and alerts
1. Competitive intelligence on autopilot
The old way: scrape competitor pricing manually, dump it into a spreadsheet, cross-reference with ad performance, try to spot correlations. By the time you find something, the moment has passed.
The agentic way: an n8n workflow scrapes competitor data daily and ingests it directly into Databox via MCP. The agent monitors for correlations with performance metrics. When it detects something significant — a competitor dropping prices while your CPA spikes — it sends a Slack alert with context. You get the signal at the moment it’s actionable, not a week later.
2. Reports that write and send themselves
The old way: every Monday, you’d log into Google Ads, Meta, GA4, export last week’s data, format it for email, send to stakeholders. Forty-five minutes, every single week, whether or not anything interesting happened.
The agentic way: an n8n workflow triggers every Monday at 9 AM. The agent pulls last week’s metrics via MCP, formats them for Slack and email, and sends automatically. The reports are consistent, never late, and free up the analyst’s Monday morning for the work that actually requires judgment.
Campaign intelligence
3. Instant campaign comparisons
The old way: export campaign data to CSV, build pivot tables, calculate ROAS manually, create comparison charts in Excel. Twenty-five minutes for a question that should take seconds.
The agentic way: upload the CSV or query directly if the data lives in Databox. Ask: “Which campaign performed better and why?” Get a comparison table, the key differentiators, and a chart in 30 seconds.
4. Forecasting with documented assumptions
The old way: build a trend model in a spreadsheet, manually note algorithm updates and seasonal factors, adjust on gut feel, defend the forecast in a meeting with “I think” and “probably.”
The agentic way: upload historical data plus a log of algorithm updates. Ask: “Forecast Q3 traffic accounting for these updates.” Get a baseline scenario and an optimistic scenario with explicit assumptions. The AI shows its reasoning. You can defend the forecast because the assumptions are documented, not intuited.
5. On-demand performance summaries
The old way: pull numbers from dashboards, write a summary, format metrics, proofread, send. Fifteen to twenty minutes for something that should be trivial.
The agentic way: ask the agent to draft an email summarizing last week’s ad performance with key callouts. Copy, paste, send. Last-minute Friday afternoon updates go from dreaded to done in under two minutes.
Multi-client management
6. Real-time benchmark comparisons
The old way: export client data, find an industry benchmark report, manually compare metrics, build a comparison table. Thirty to forty-five minutes per client.
The agentic way: upload benchmark data once. Ask: “How does Client A compare to industry average on CAC, LTV, and churn?” Get a comparison table and chart immediately. Answer “How are we doing?” in real time on the client call rather than promising a follow-up.
7. Cross-client audits without context-switching
The old way: log into Client A’s account, export, log into Client B, export, log into Client C, export, combine in a spreadsheet, and create comparison charts. An hour of manual work.
The agentic way: “Show ad spend and ROAS for all three clients, last 30 days.” One question, consolidated table and chart in 30 seconds.
8. Pre-call prep in two minutes
The old way: open multiple dashboards, screenshot key metrics, paste into a slide deck, write summary notes. Twenty minutes of rushed work before every call.
The agentic way: “Give me a performance summary for Brand X — traffic, conversions, and ad spend trends.” Get a visual summary with all KPIs. Drill into anything that looks off in the same conversation. Walk into the call prepared, not scrambling.
Data operations
9. Root cause analysis without the fire drill
The old way: notice a drop in the dashboard, segment by source and medium, cross-reference with external events, Google for algorithm updates, connect the dots manually. One to two hours of investigation while stakeholders ping you, asking what happened.
The agentic way: “Why did traffic drop last week?” The agent identifies: “27% decrease in google/organic, coinciding with the March 15 core update.” Follow up: “How did competitors fare?” Root cause in two questions. From panic to diagnosis before the Slack thread escalates.
10. Metric audits for the skeptical executive
The old way: review data source documentation, check integration settings, trace calculated metrics through the system, write a summary explaining where each number comes from. Two to three hours of documentation work.
The agentic way: “Show all revenue metrics and their sources.” Get a complete inventory. Follow up: “How is Net Revenue calculated?” Get the formula and data sources. When the board asks “How do we know this is accurate?”, you show them exactly where every number comes from — in real time, during the meeting.
11. Data cleanup without the spreadsheet gymnastics
The old way: open a messy CSV in Excel, fix column headers, standardize date formats, remove empty rows and duplicates, re-export. Thirty to sixty minutes of tedious work.
The agentic way: upload the CSV. “Clean this up — standardize dates, remove duplicates, fix headers — and show me a preview.” Review the preview, confirm, done.
12. Multi-source data merging
The old way: export ad spend from Google Ads, export revenue from the CRM, VLOOKUP by date (hope the formats reconcile), calculate ROAS, create a chart. Thirty to forty-five minutes, assuming nothing breaks.
The agentic way: upload both CSVs. “Merge these by date and calculate ROAS.” Get a merged table and a dual-axis chart in one minute. Multiple sources, one conversation, complete picture.
Advanced: combining live data with current market intelligence
13. Deep research plus live data
This is the workflow that changed how I approach strategic decisions.
LLMs have knowledge cutoffs. They can’t tell you about the algorithm update that rolled out last week or the competitor move reshaping your market right now. But deep research tools can — Gemini Deep Research, Perplexity, GPT web browsing can crawl 100–250 recent sources and synthesize current market intelligence.
The agentic move: combine deep research with live business data via MCP.
Step 1: Feed your AI assistant your business context — what you sell, your ICP, your positioning, your current challenges.
Step 2: Run 1–3 deep research queries on current market conditions relevant to your situation.
Step 3: Connect to Databox via MCP and pull your actual performance metrics — traffic trends, conversion rates, campaign performance.
Step 4: Ask the AI to interpret your data in light of the research. “Given what’s happening in the market right now, what do these trends suggest? What should I do differently?”
You’re combining three things that rarely exist in the same room: current market intelligence, your actual business data, and an AI that can synthesize both into actionable recommendations. The research brings “what’s happening out there.” MCP brings “what’s happening in here.” The agent connects the dots.
What actually changes when the loop closes
Here’s what months of working this way have taught me: the time savings are real, but they’re not the point.
| Task | Old method | Time | Agentic method | Time | Change |
|---|---|---|---|---|---|
| Weekly reporting | Manual export + format | 45 min | Automated | 0 min | 100% |
| Campaign comparison | Excel pivot tables | 25 min | Query + ask | 30 sec | 98% |
| Cross-client audit | Multiple logins + export | 60 min | Single query | 30 sec | 99% |
| Traffic diagnostics | Manual investigation | 90 min | 2 questions | 2 min | 98% |
| Data cleanup | Excel formatting | 45 min | Agent pass | 1 min | 98% |
Average time reduction across these tasks: 97%.
But time is the wrong frame for understanding what actually changes.
When analysis takes 25 minutes, you only do it when you have to. You rely on scheduled reports. You make decisions with incomplete information because getting the complete picture costs more than the decision is worth.
When the analysis takes 30 seconds, you check everything. You follow the thread. You ask the second and third question. You catch the anomaly before it becomes a fire drill.
When an agent closes the loop automatically, you stop catching problems and start preventing them. The ROAS drop doesn’t become a conversation on Wednesday morning because it was handled Tuesday night.
The real win isn’t the 45 minutes saved on Monday. It’s that decisions get made on actual data instead of assumptions, and some decisions get made by the agent before you’d have had time to make them yourself.
Getting started: building toward the full loop
Week 1 — Foundation
- Choose an analytics platform whose MCP server can both query and ingest. Databox’s does.
- Connect the MCP server to your AI assistant of choice (Claude, ChatGPT, Cursor)
- Test basic queries against your live data to establish a baseline for accuracy
Weeks 2–4 — Conversational layer
- Replace one or two recurring manual reports with agent-generated equivalents
- Document the prompts that work well — you will reuse them
- Identify which recurring decisions in your workflow are rule-based enough to delegate
Weeks 5–8 — First automation
- Set up alert workflows for metrics that matter — anomaly detection that notifies rather than waiting for you to check
- Build your first closed-loop workflow: observe threshold breach → act on it → log the action
- Create prompt templates for common analyses so the rest of the team can run them without your involvement
Months 3–6 — Full agentic loop
- Multi-source data ingestion for competitive and external signals
- Automated reporting that not only sends itself but flags anomalies and suggests follow-up actions
- Custom metric creation via data ingestion for signals you’re not yet tracking
The learning curve is real. Prompt engineering is a skill and agent workflow design requires clear thinking about decision boundaries. But it’s a shorter curve than learning SQL or building a data pipeline, and the payoff compounds — each workflow you automate frees up the analytical attention for the decisions that genuinely need it.
Conclusion
By 2027, every major data platform will have MCP integration of some kind. The question won’t be whether your AI can access your analytics — it’ll be whether your AI can close the loop, or just observe it.
The companies that figure out the full Agentic OODA Loop early will make decisions faster, catch problems sooner, and run more experiments. That compounds over time in ways that are hard to close from behind.
We’re moving from data as something you look at to data as something that acts. The interface becomes invisible. The loop runs itself.
Skip the complex setup and get straight to the answers. Try Databox for free to experience true AI-powered business analytics. Connect your sources in seconds and use the Databox analytics MCP to chat with your data — and automate what you used to do manually — inside Claude, Cursor, and more.
Frequently Asked Questions
How long does it take to set up the first workflow?
Anything that speaks MCP. I use Claude for analysis and n8n for scheduled workflows. ChatGPT and Cursor also connect. The assistant handles language and decisions. Databox handles the numbers.
Which AI assistants work with these workflows?
Anything that speaks MCP. I use Claude for analysis and n8n for scheduled workflows. ChatGPT and Cursor also connect. The assistant handles language and decisions. Databox handles the numbers.
What is the difference between query-only and query-and-ingest MCP?
Query-only MCP lets an AI agent read existing data and answer questions about it. Query-and-ingest MCP also lets the workflow write new data back into the system: logging actions, recording results, and adding external signals. Ingest is what turns a question-answering setup into one that keeps a record of what it did.
How do I know the agent's decisions are based on accurate data?
Architecture determines accuracy. Agents that compute results using LLM reasoning introduce hallucination risk at the point of action. Agents that retrieve results from live queries against governed data sources act on actual numbers, not generated ones. Before deploying any agentic analytics system, ask: when the agent detects an anomaly, is it acting on a queried data result or on an LLM-generated assessment? The answer determines whether you can trust the decisions.
What governance controls should be in place before deploying AI agents?
Define action boundaries clearly before any agent goes live. Which decisions is the agent authorized to make autonomously? Which require human approval? A well-governed agentic system has explicit thresholds: below-threshold ROAS triggers a campaign pause automatically; budget reallocation above a defined amount requires a human sign-off, with the agent flagging and waiting. Every automated action and every escalation should be logged with the reasoning behind it.
Do I need a data warehouse to use agentic analytics?
Not with Databox. Most enterprise agentic analytics platforms are warehouse-first — they require data to be centralized before agents can act on it. Databox connects to 130+ SaaS sources natively, which means agents can observe, decide, and act on data across your CRM, ad platforms, and web analytics without a warehouse layer between them.