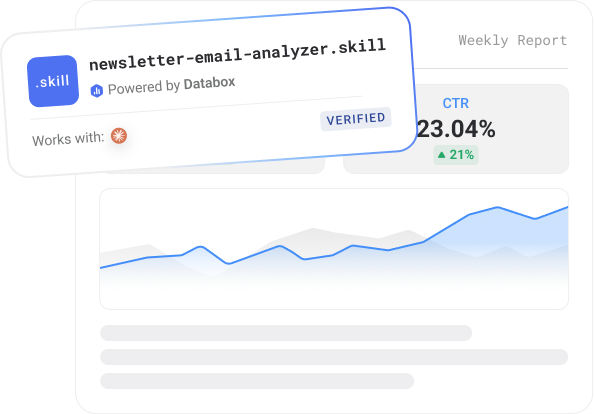
Newsletter Email Analyzer
A Claude skill that connects to your Databox workspace via MCP and explains why some email sends outperform others — not just which ones did. It pulls your campaign performance (sends, opens, clicks), matches each campaign to its actual subject line, ranks every send by open rate, and classifies the subject-line patterns behind your wins. The output is a self-contained HTML report with a ranked scorecard, an open-rate chart against your own average, the patterns that consistently outperform, and five subject-line recommendations you can use on your next sends.
- ~5 minutes setup
- Runs on demand
- Claude + Databox MCP
- Works with
- Claude
- Requires
- Databox account + Databox MCP
- Data source
- ActiveCampaign, HubSpot Marketing, Klaviyo, Mailchimp
- Output
- HTML report
- Best for
- Growth teams, agencies, founders
- Setup time
- ~5 minutes
What it does
Most email programs track open rates but can’t explain them. You see that one newsletter hit and another flopped, but the reason stays a guess — so the next send is a guess too.
This skill closes that gap. Connect your email platform to Databox, trigger the analysis, and it pulls your campaign performance, matches each campaign to its real subject line, and calculates open rate, CTR, and click-to-open for every send. It ranks them, grades each one Strong / Average / Weak, and flags sends where an unusually large list size — not the content — explains the result, so you don’t draw the wrong lesson.
Then it does the part a dashboard can’t: it classifies your subject lines by pattern — curiosity gap, authority/data hook, “stop” openers, questions, time-savings framing — computes the average open rate for each, and tells you which patterns win for your audience. It checks whether numbers beat no-numbers, questions beat statements, and whether length correlates with opens.
You get back five data-backed insights and five recommendations, each with a ready-to-use subject line for your next send. Works with any email platform connected to Databox — HubSpot, Mailchimp, ActiveCampaign, Klaviyo, and others — and auto-discovers your metric keys, so there’s no configuration. Run it weekly and it sharpens as your send history grows.
No AI hallucinations. Analysis built on a real context layer.
Ask a generic AI to analyse your business performance and it will give you a confident answer. It will also be working from assumptions.
Generic AI doesn't know how your business defines a qualified lead, what your MRR calculation includes, or how you attribute revenue. It fills those gaps with the most plausible interpretation it can find — which is different from the correct one.
The products here run on Databox's data layer — if you choose so. Your metric definitions, your reporting logic, and your live numbers are what the AI reads, pulled straight through Databox MCP instead of uploaded by hand. That's the difference between an output you can share with your team and one you have to verify before you trust it.
Who it's for
What's in the package
Security scanned Reviewed by DataboxHow to use it
Example prompts you can ask Claude
What you need to run this
Claude
Free to download. Required to install and run skills.
Databox account
The skill connects to your data in Databox. The free plan includes all integrations you need to use this skill.
MCP connection
Connector inside your Claude. Takes less than a minute to set up. Full instructions in the setup guide included in the download.
Free to start. Connect your first integration in minutes — no credit card required.
Connect any AI tool to your Databox data with Databox MCP.
Databox MCP is the bridge between your live metrics and any AI — Claude, ChatGPT, Cursor, or any client that speaks MCP. One auth, every workspace, no scraping.

Example output
Common questions
What does the Newsletter Email Analyzer do?
It's a Claude skill that connects to your Databox workspace through MCP and turns your email campaign data into a performance report that explains what's driving opens. It ranks every send by open rate, matches each to its subject line, identifies the subject-line patterns that consistently outperform, and gives you five recommendations with ready-to-use subject lines for your next sends.
What data sources does it need?
An email marketing platform connected to Databox — HubSpot, Mailchimp, ActiveCampaign, Klaviyo, or another supported email tool. The skill auto-discovers your metric keys, so no configuration is needed. To unlock subject-line pattern analysis, you also provide your subject lines once — by Google Sheet, file upload, paste, or a connected tool.
What's in the output?
A self-contained HTML report: summary metric cards, a scorecard ranking every campaign by open rate with a Strong/Average/Weak grade, an open-rate bar chart against your historical average, a subject-line pattern table with the top-performing formulas, five data-backed insights, and five recommendations — each with a suggested subject line. Plus a 3-bullet summary in chat.
Do I need a Databox account to use this skill?
Yes, ideally — and here's why it matters. Point a generic AI at a raw data export and it has to guess what your numbers mean: which conversions count, how you define an engaged session, what a "normal" week looks like. It fills those gaps with the most plausible interpretation it can find, which is often not the correct one. The skill avoids that by reading your data live from Databox through MCP, where your metrics are already standardized — one consistent definition for sessions, engagement, and conversions across your setup. The AI reads what's actually true for your business instead of inferring it, so the report is one you can trust rather than verify. You can technically run it against data you've pasted in by hand, but you lose that context layer and the output is only as reliable as the export. If you don't have an account or data source connected yet, the skill walks you through the setup.
Can I use this with the free Databox plan?
Yes — the free Databox plan includes the integration this skill needs, so you can run it at no cost. The skill itself is also free to download.
Does this use live data from my connected source?
Yes — every run reads your live data directly from Databox through the MCP connection. The report reflects your current data at the moment you run it, not a cached or uploaded snapshot.
Do I need to export data manually?
No — there are no CSV exports and no copy-paste. The skill pulls your data straight from Databox through MCP each time it runs, so the report is always built from your live source.
Can agencies run this for multiple clients?
Yes — run it against each client's data connected in Databox, one account at a time, and you get the same structured weekly brief for every client. It's built to give a consistent report you can take to each client review.
Can I customize the report?
Yes. Before it runs, the skill asks a few onboarding questions — what you want to measure, the time frame, and any context that matters for the analysis — so the report is shaped to your goals from the start. After a run, you can give it feedback to adjust focus, sections, or anomaly thresholds, and reinstall the updated version so your changes carry into future runs.
Morning Marketing Summary
Pulls live data from all connected marketing channels via Databox and delivers a performance brief to Slack/email
Content Performance Partner
Every published page sorted into keep, refresh, or retire — a prioritized monthly editorial work queue written from live
Weekly Growth Dashboard
Your Monday-morning growth read — GA4, Search Console, and CRM in one rolling 4-week comparison & recommendations.
-

-

-

- +2


