Linkedin Ads Performance Report
A Claude skill that connects to your Databox workspace via MCP and writes a structured monthly LinkedIn Ads performance report from live campaign and creative-level data. Covers reach, content relevance, engagement, top ads by campaign type, and 6-month spend trends - with every campaign benchmarked against 2025-2026 industry norms by format, not blended account averages. Output: a self-contained HTML report in under 90 seconds.
- ~5 min setup
- Runs on demand
- Claude + Databox MCP
What it does
LinkedIn Ads Performance Report is a Claude skill that connects to your LinkedIn Ads account and writes a structured monthly performance report from live campaign and creative-level data. The output is a self-contained HTML file covering reach, content relevance, engagement, top performing ads by campaign type, and 6-month spend trends — built from 30 days of data to give results that are statistically meaningful rather than directional.
The report follows a fixed structure every run: an account overview with a visual engagement funnel and key metric deltas; a budget section with MTD pacing and a 6-month stacked spend chart by campaign type; a reach section showing impressions, CPM, frequency, and estimated unique reach; a relevance section showing average dwell time and CTR by campaign — LinkedIn’s best proxy for whether content is stopping the scroll; an engagement section with campaign-level CTR, clicks, engagement rate, and CPC with top creatives ranked; and a Top Performing Ads section that ranks the best three ads in each campaign type against 2025–2026 industry benchmarks by format. The report closes with a 6-month trends section — dual-axis spend versus conversions plus a tabbed chart switchable across eight metrics — and two observation sections flagging patterns worth reviewing and signals to watch next month.
Run it once a month before any budget conversation, campaign debrief, or LinkedIn Ads review. The first run takes about two minutes to configure — the skill asks about your conversion goal, industry, campaign objectives, and budget, then saves the settings permanently. Every subsequent run goes straight to the data. It replaces pulling campaign screenshots from LinkedIn Campaign Manager, reformatting metrics manually, and writing a summary from scratch — a process that typically takes 45–60 minutes per reporting cycle.
Who it's for
What's in the package
Security scanned Reviewed by DataboxWhat you need to run this
Claude
Free to download. Required to install and run skills.
Databox account
The skill connects to your data in Databox. The free plan includes all integrations you need to use this skill.
MCP connection
Connector inside your Claude. Takes less than a minute to set up. Full instructions in the setup guide included in the download.
Free to start. Connect your first integration in minutes — no credit card required.
How to use it
Connect any AI tool to your Databox data with Databox MCP.
Databox MCP is the bridge between your live metrics and any AI — Claude, ChatGPT, Cursor, or any client that speaks MCP. One auth, every workspace, no scraping.

No AI hallucinations. Analysis built on a real context layer.
Ask a generic AI to analyse your business performance and it will give you a confident answer. It will also be working from assumptions.
Generic AI doesn't know how your business defines a qualified lead, what your MRR calculation includes, or how you attribute revenue. It fills those gaps with the most plausible interpretation it can find — which is different from the correct one.
The products here run on Databox's data layer — if you choose so. Your metric definitions, your reporting logic, and your live numbers are what the AI reads, pulled straight through Databox MCP instead of uploaded by hand. That's the difference between an output you can share with your team and one you have to verify before you trust it.
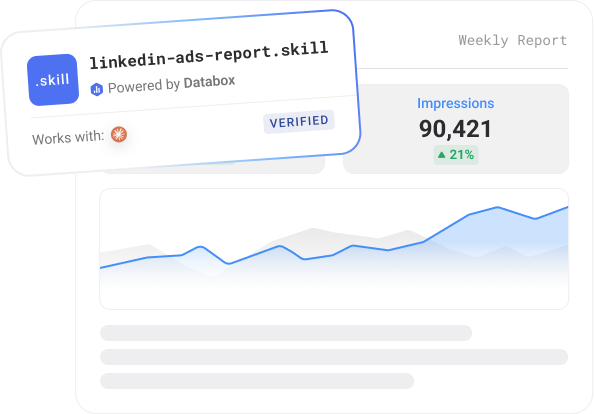
Example output
Common questions
Do I need a Databox account to use this skill?
Yes, ideally — and here's why it matters. Point a generic AI at a raw data export and it has to guess what your numbers mean: which conversions count, how you define an engaged session, what a "normal" week looks like. It fills those gaps with the most plausible interpretation it can find, which is often not the correct one. The skill avoids that by reading your data live from Databox through MCP, where your metrics are already standardized — one consistent definition for sessions, engagement, and conversions across your setup. The AI reads what's actually true for your business instead of inferring it, so the report is one you can trust rather than verify. You can technically run it against data you've pasted in by hand, but you lose that context layer and the output is only as reliable as the export. If you don't have an account or data source connected yet, the skill walks you through the setup.
Can I use this with the free Databox plan?
Yes — the free Databox plan includes the integration this skill needs, so you can run it at no cost. The skill itself is also free to download.
Does this use live data from my connected source?
Yes — every run reads your live data directly from Databox through the MCP connection. The report reflects your current data at the moment you run it, not a cached or uploaded snapshot.
Do I need to export data manually?
No — there are no CSV exports and no copy-paste. The skill pulls your data straight from Databox through MCP each time it runs, so the report is always built from your live source.
Can agencies run this for multiple clients?
Yes — run it against each client's data connected in Databox, one account at a time, and you get the same structured weekly brief for every client. It's built to give a consistent report you can take to each client review.
Can I customize the report?
Yes. Before it runs, the skill asks a few onboarding questions — what you want to measure, the time frame, and any context that matters for the analysis — so the report is shaped to your goals from the start. After a run, you can give it feedback to adjust focus, sections, or anomaly thresholds, and reinstall the updated version so your changes carry into future runs.
Daily Paid Acquisition and Website Intelligence Report
Runs three AI agents each morning to correlate paid and website data, then emails 3 budget recommendations.
-

-

-

- +6
Paid Ads Cross-Channel Performance Report
One report across all connected ad platforms. Each channel judged against its own funnel goal, not a single standard.
-
-
-
- +2
Google Ads Performance Report
Brand vs non-brand. CPA vs target. Impression share. A full Google Ads campaign report from live Databox data.


