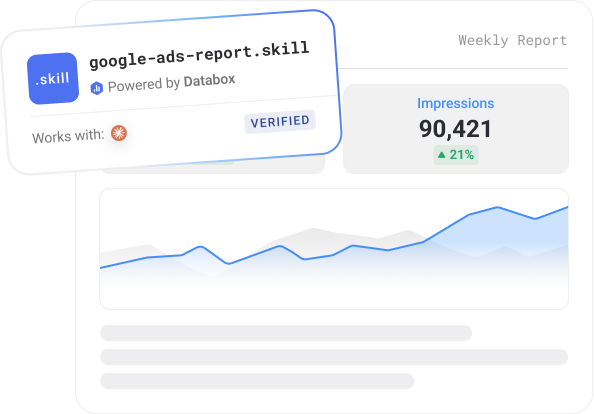
Google Ads Performance Report
A Claude skill that connects to your Databox workspace via MCP and writes a structured Google Ads performance report from live campaign-level data. Pulls spend, conversions, IS, CPA, clicks, and CTR at campaign, ad group, and keyword level — split by brand vs non-brand. Output: a twelve-section HTML report with budget pacing, CPA gauge vs target, 6-month trend charts, campaign rankings, and anomaly flags in under 90 seconds.
- ~5 minutes setup
- Runs on demand
- Claude + Databox MCP
- Works with
- Claude
- Requires
- Databox account + Databox MCP
- Data source
- Google Ads
- Output
- HTML report
- Best for
- Growth teams, agencies, founders
- Setup time
- ~5 minutes
What it does
Google Ads reporting is typically a manual process — exporting campaign data, building a pivot table, and cross-referencing brand vs non-brand performance separately. This skill does it in a single run from live data.
Connect your Databox workspace, trigger the skill, and it pulls campaign-level data from Google Ads via MCP — spend, clicks, impressions, CTR, CPC, conversions, CPA, conversion rate, and impression share — broken down at campaign, ad group, and keyword level. The first run takes two minutes to configure. Every run after that is one trigger.
The report follows a fixed twelve-section structure: a period recap with the key finding in plain English; an account snapshot with six metric cards and period-over-period deltas; a budget section showing MTD spend vs monthly budget with pacing status, brand vs non-brand spend breakdown, and a 6-month stacked chart by campaign type; a cost vs target section with CPA gauges for blended, brand, and non-brand — green when under target, red when above; 6-month performance trend charts with a dual-axis spend vs conversions view and a tabbed chart switchable by metric and filterable by brand vs non-brand; a brand vs non-brand side-by-side analysis; a campaign table grouped by type with sortable columns and inline delta badges; impression share signals per Search campaign; top ad groups and top keywords by conversions for brand and non-brand separately; a business impact section connecting spend to CRM or revenue metrics if a secondary source is configured; and an anomaly flags section with URGENT / WATCH / INFO severity classification.
On first run the skill asks nine setup questions — conversion goal, CPA target, brand vs non-brand naming convention, conversion tracking reliability, secondary business metrics source, bid strategy, and monthly budget — then saves your configuration permanently into the skill file. Every subsequent run skips setup and goes straight to the data pull.
No AI hallucinations. Analysis built on a real context layer.
Ask a generic AI to analyse your business performance and it will give you a confident answer. It will also be working from assumptions.
Generic AI doesn't know how your business defines a qualified lead, what your MRR calculation includes, or how you attribute revenue. It fills those gaps with the most plausible interpretation it can find — which is different from the correct one.
The products here run on Databox's data layer — if you choose so. Your metric definitions, your reporting logic, and your live numbers are what the AI reads, pulled straight through Databox MCP instead of uploaded by hand. That's the difference between an output you can share with your team and one you have to verify before you trust it.
Who it's for
What's in the package
Security scanned Reviewed by DataboxHow to use it
What you need to run this
Claude
Free to download. Required to install and run skills.
Databox account
The skill connects to your data in Databox. The 14-day trial and all paid plans include all integrations you need to use this skill.
MCP connection
Connector inside your Claude. Takes less than a minute to set up. Full instructions in the setup guide included in the download.
Free to start. Connect your first integration in minutes — no credit card required.
Connect any AI tool to your Databox data with Databox MCP.
Databox MCP is the bridge between your live metrics and any AI — Claude, ChatGPT, Cursor, or any client that speaks MCP. One auth, every workspace, no scraping.

Example output
Report structure
Every run produces a structured report with these sections:
- Account Snapshot
- Budget
- Cost vs Target
- 6-Month Performance Trends
- Brand vs Non-Brand
- Campaign Table
- Impression Share
- Top Ad Groups
- Top Keywords
- Business Impact
- Anomaly Flags
Common questions
What does the Google Ads Performance Report do?
It's a Claude skill that connects to your Databox workspace through MCP and writes a structured Google Ads performance report from live data. It covers account-level spend and efficiency, budget pacing, CPA tracking against your targets, brand vs non-brand split, campaign-level performance, and 6-month trend charts - all in a single run.
What data sources does it need?
Google Ads, connected to your Databox account. That's the only source this skill reads from. On first run it asks for your monthly budget and CPA target, then saves those for every subsequent run.
What's in the output?
A report with seven sections: a period recap with a key finding headline and color-coded bullets; an account snapshot with spend, clicks, impressions, conversions, CPA, and avg CPC; budget pacing with MTD spend vs target and brand vs non-brand split; CPA gauge charts for blended, brand, and non-brand; 6-month trend charts for spend and conversions; a campaign-level performance table with MoM deltas; and a search terms table flagging high-spend, low-conversion terms.
Do I need a Databox account to use this skill?
Yes, ideally — and here's why it matters. Point a generic AI at a raw data export and it has to guess what your numbers mean: which conversions count, how you define an engaged session, what a "normal" week looks like. It fills those gaps with the most plausible interpretation it can find, which is often not the correct one. The skill avoids that by reading your data live from Databox through MCP, where your metrics are already standardized — one consistent definition for sessions, engagement, and conversions across your setup. The AI reads what's actually true for your business instead of inferring it, so the report is one you can trust rather than verify. You can technically run it against data you've pasted in by hand, but you lose that context layer and the output is only as reliable as the export. If you don't have an account or data source connected yet, the skill walks you through the setup.
Do I need a paid Databox plan to run this skill?
The skill is free to download. Running it requires the Databox MCP connection, which isn't included on the forever free plan. Every new Databox account starts with a 14-day free trial that includes everything the skill needs — after that, any paid plan covers it, including the Analyst plan.
Does this use live data from my connected source?
Yes — every run reads your live data directly from Databox through the MCP connection. The report reflects your current data at the moment you run it, not a cached or uploaded snapshot.
Do I need to export data manually?
No — there are no CSV exports and no copy-paste. The skill pulls your data straight from Databox through MCP each time it runs, so the report is always built from your live source.
Can agencies run this for multiple clients?
Yes — run it against each client's data connected in Databox, one account at a time, and you get the same structured weekly brief for every client. It's built to give a consistent report you can take to each client review.
Can I customize the report?
Yes. Before it runs, the skill asks a few onboarding questions — what you want to measure, the time frame, and any context that matters for the analysis — so the report is shaped to your goals from the start. After a run, you can give it feedback to adjust focus, sections, or anomaly thresholds, and reinstall the updated version so your changes carry into future runs.
Search & Traffic Performance Skills
Three free Claude skills, one complete picture — website performance, search rankings, and AI visibility, reported from
-

-

-

- +3
Set Baseline
Set an honest, seasonality-aware baseline for any metric before a campaign — a typical-range band with confidence.
Morning Marketing Summary
Pulls live data from all connected marketing channels via Databox and delivers a performance brief to Slack/email


