Monthly Linkedin Ads Analytics
A Claude skill that pulls 30 days of LinkedIn Ads data from Databox, benchmarks it across reach, relevance, engagement, and pipeline, compares it to the prior period, and renders a clean one-page PDF ready for a client or stakeholder meeting.
- ~5 minutes setup
- Runs on demand
- Claude + Databox MCP
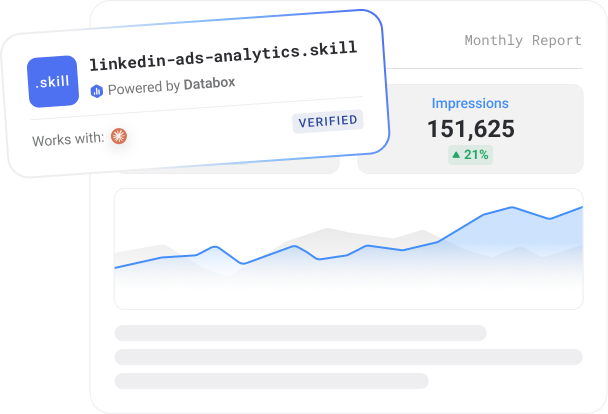
- Works with
- Claude
- Requires
- Databox account + Databox MCP
- Data source
- LinkedIn Ads
- Output
- HTML report
- Best for
- Growth teams, agencies, founders
- Setup time
- ~5 minutes
What it does
Putting together a monthly LinkedIn Ads report a client will actually read means pulling 30 days of data, lining it up against the prior month, deciding what’s good and what’s not, and writing the story — every month, per account. It’s an hour of work that mostly repeats.
This skill turns it into one page. Connect LinkedIn Ads to Databox, name the account and window, and it pulls both periods and organizes everything into four pillars: Reach (impressions, member reach, CPM, frequency), Relevance (CTR, CPC, clicks, dwell time), Engagement (engagements, engagement rate), and Pipeline (conversions, cost per conversion, leads, CPL — whichever the account actually has). Each benchmarked metric gets a Good / OK / Watch badge, and every metric shows period-over-period change colored by whether it’s actually an improvement.
It knows the LinkedIn-specific pitfalls. It never benchmarks on blended CTR — it isolates image-ad CTR at campaign level so Text Ad campaigns don’t drag the number down, and it flags those separately. It checks frequency against a healthy range and calls out fatigue. It reports in the account’s native currency without forcing conversions.
The result is a one-page PDF — four pillar cards, a full period-over-period table, and a handful of auto-written talking points that lead with the win, flag the one thing to action, and name an opportunity. Run it per account, monthly, before the call.
No AI hallucinations. Analysis built on a real context layer.
Ask a generic AI to analyse your business performance and it will give you a confident answer. It will also be working from assumptions.
Generic AI doesn't know how your business defines a qualified lead, what your MRR calculation includes, or how you attribute revenue. It fills those gaps with the most plausible interpretation it can find — which is different from the correct one.
The products here run on Databox's data layer — if you choose so. Your metric definitions, your reporting logic, and your live numbers are what the AI reads, pulled straight through Databox MCP instead of uploaded by hand. That's the difference between an output you can share with your team and one you have to verify before you trust it.
Who it's for
What's in the package
Security scanned Reviewed by DataboxHow to use it
Example prompts you can ask Claude
What you need to run this
Claude
Free to download. Required to install and run skills.
Databox account
The skill connects to your data in Databox. The free plan includes all integrations you need to use this skill.
MCP connection
Connector inside your Claude. Takes less than a minute to set up. Full instructions in the setup guide included in the download.
Free to start. Connect your first integration in minutes — no credit card required.
Connect any AI tool to your Databox data with Databox MCP.
Databox MCP is the bridge between your live metrics and any AI — Claude, ChatGPT, Cursor, or any client that speaks MCP. One auth, every workspace, no scraping.

Example output
Common questions
What does Monthly LinkedIn Ads Analytics do?
It's a Claude skill that connects to your Databox workspace through MCP and builds a one-page monthly LinkedIn Ads report. It pulls 30 days of data, organizes it into Reach / Relevance / Engagement / Pipeline, benchmarks and badges each metric, compares to the prior period, and renders a client-ready PDF with talking points.
What data sources does it need?
A LinkedIn Ads data source connected in Databox, read through the Databox MCP. It pulls impressions, reach, CPM, frequency, CTR, CPC, clicks, dwell time, engagements, engagement rate, spend, conversions, cost per conversion, and (where present) leads and CPL — for both the current and prior 30-day windows.
How does it handle benchmarks and CTR?
It benchmarks each metric against built-in B2B LinkedIn Ads benchmarks and badges it Good / OK / Watch. Critically, it benchmarks image-ad CTR at the campaign level — excluding Text Ad campaigns, which carry near-zero CTR and distort the blended account number — and reports in the account's native currency without converting.
Do I need a Databox account to use this skill?
Yes, ideally — and here's why it matters. Point a generic AI at a raw data export and it has to guess what your numbers mean: which conversions count, how you define an engaged session, what a "normal" week looks like. It fills those gaps with the most plausible interpretation it can find, which is often not the correct one. The skill avoids that by reading your data live from Databox through MCP, where your metrics are already standardized — one consistent definition for sessions, engagement, and conversions across your setup. The AI reads what's actually true for your business instead of inferring it, so the report is one you can trust rather than verify. You can technically run it against data you've pasted in by hand, but you lose that context layer and the output is only as reliable as the export. If you don't have an account or data source connected yet, the skill walks you through the setup.
Can I use this with the free Databox plan?
Yes — the free Databox plan includes the integration this skill needs, so you can run it at no cost. The skill itself is also free to download.
Does this use live data from my connected source?
Yes — every run reads your live data directly from Databox through the MCP connection. The report reflects your current data at the moment you run it, not a cached or uploaded snapshot.
Do I need to export data manually?
No — there are no CSV exports and no copy-paste. The skill pulls your data straight from Databox through MCP each time it runs, so the report is always built from your live source.
Can agencies run this for multiple clients?
Yes — run it against each client's data connected in Databox, one account at a time, and you get the same structured weekly brief for every client. It's built to give a consistent report you can take to each client review.
Can I customize the report?
Yes. Before it runs, the skill asks a few onboarding questions — what you want to measure, the time frame, and any context that matters for the analysis — so the report is shaped to your goals from the start. After a run, you can give it feedback to adjust focus, sections, or anomaly thresholds, and reinstall the updated version so your changes carry into future runs.
Morning Marketing Summary
Pulls live data from all connected marketing channels via Databox and delivers a performance brief to Slack/email
Content Performance Partner
Every published page sorted into keep, refresh, or retire — a prioritized monthly editorial work queue written from live
Newsletter Email Analyzer
Reads your email data, matches it to subject lines, shows which patterns drive opens, plus subject lines to write next
-

-

-

- +1


