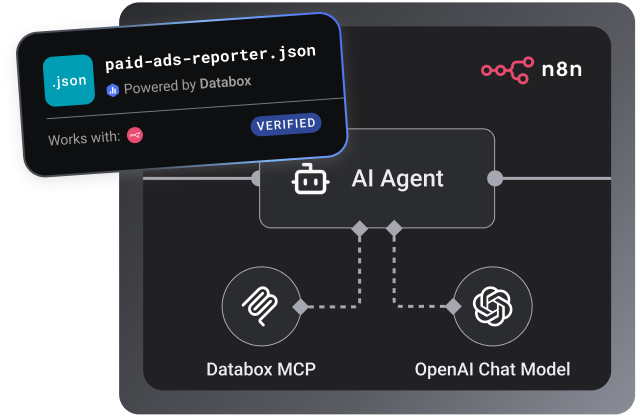
Weekly Paid Ads Performance Reports
An n8n workflow that connects to Databox via MCP, auto-discovers all connected ad platforms, pulls 6 key metrics with WoW deltas across every platform, and delivers two outputs every Monday at 9 AM: a Slack summary with aggregated totals and a full HTML email with a per-platform breakdown table - no manual input at any step.
- ~5 minutes setup
- Runs on demand
- n8n + Databox MCP
- Works with
- n8n
- Requires
- Databox account + Databox MCP
- Data source
- Facebook Ads, Google Ads, LinkedIn Ads, Microsoft Advertising, Pinterest Ads, Reddit Ads, Snapchat Ads, TikTok Ads, X (Twitter) Ads
- Output
- HTML report
- Best for
- Growth teams, agencies, founders
- Setup time
- ~5 minutes
What it does
Most paid ads teams pull weekly numbers manually – one platform at a time, every Monday. This workflow eliminates that entirely. It triggers on a schedule, queries Databox via MCP to discover which ad platforms you have connected, pulls Cost, Clicks, CPC, CTR, Impressions, and Conversions for the last 7 days and the prior 7 days, calculates WoW deltas across all platforms, and delivers two outputs simultaneously: a concise Slack summary with aggregated totals and per-platform highlights, and a full HTML email with a platform-by-platform breakdown table. Supported platforms: Facebook Ads, Google Ads, LinkedIn Ads, YouTube Ads, Reddit Ads, TikTok Ads, Snapchat Ads, Microsoft Advertising, X Ads, Pinterest Ads. The workflow adapts to whichever are connected – disconnected platforms are silently skipped.
No AI hallucinations. Analysis built on a real context layer.
Ask a generic AI to analyse your business performance and it will give you a confident answer. It will also be working from assumptions.
Generic AI doesn't know how your business defines a qualified lead, what your MRR calculation includes, or how you attribute revenue. It fills those gaps with the most plausible interpretation it can find — which is different from the correct one.
The products here run on Databox's data layer — if you choose so. Your metric definitions, your reporting logic, and your live numbers are what the AI reads, pulled straight through Databox MCP instead of uploaded by hand. That's the difference between an output you can share with your team and one you have to verify before you trust it.
Who it's for
What's in the package
Security scanned Reviewed by DataboxHow to use it
What you need to run this
n8n
Free and open-source. Self-host it or run it on n8n Cloud to import and execute the workflow.
Databox account
The workflow reads your live metrics through Databox MCP. The 14-day trial and all paid plans include the integrations you need to get started.
MCP connection
Connector inside your n8n. Takes less than a minute to set up. Full instructions in the setup guide included in the download.
Free to start. Connect your first integration in minutes — no credit card required.
Connect any AI tool to your Databox data with Databox MCP.
Databox MCP is the bridge between your live metrics and any AI — Claude, ChatGPT, Cursor, or any client that speaks MCP. One auth, every workspace, no scraping.

Example output
Common questions
What does the Weekly Paid Ads Performance Reports workflow do?
It's an n8n workflow that connects to Databox via MCP and delivers a formatted paid ads report every Monday at 9 AM - automatically. It auto-discovers every ad platform connected to your Databox account, pulls 6 key metrics with week-over-week deltas across all platforms, and sends two outputs: a Slack summary with aggregated totals and a full HTML email with a per-platform breakdown table. No manual input at any step.
What does it need to run?
An n8n instance, a Databox account with at least one ad platform connected, a Slack workspace, and an email address for delivery. Supported ad platforms: Facebook Ads, Google Ads, LinkedIn Ads, Microsoft Advertising, Twitter Ads, TikTok Ads, Snapchat Ads, Reddit Ads, and Pinterest Ads. The workflow discovers which are connected at runtime - you don't need all platforms active.
What's in the output?
Two weekly deliverables: a Slack message with aggregated totals across all active platforms and a WoW delta summary, and an HTML email with a per-platform breakdown table covering Cost, Clicks, CPC, CTR, Impressions, and Conversions for the last 7 days vs the prior 7 days. Both arrive every Monday at 9 AM without any manual trigger.
Do I need a Databox account to use this skill?
Yes, ideally — and here's why it matters. Point a generic AI at a raw data export and it has to guess what your numbers mean: which conversions count, how you define an engaged session, what a "normal" week looks like. It fills those gaps with the most plausible interpretation it can find, which is often not the correct one. The skill avoids that by reading your data live from Databox through MCP, where your metrics are already standardized — one consistent definition for sessions, engagement, and conversions across your setup. The AI reads what's actually true for your business instead of inferring it, so the report is one you can trust rather than verify. You can technically run it against data you've pasted in by hand, but you lose that context layer and the output is only as reliable as the export. If you don't have an account or data source connected yet, the skill walks you through the setup.
Do I need a paid Databox plan to run this skill?
The skill is free to download. Running it requires the Databox MCP connection, which isn't included on the forever free plan. Every new Databox account starts with a 14-day free trial that includes everything the skill needs — after that, any paid plan covers it, including the Analyst plan.
Does this use live data from my connected source?
Yes — every run reads your live data directly from Databox through the MCP connection. The report reflects your current data at the moment you run it, not a cached or uploaded snapshot.
Do I need to export data manually?
No — there are no CSV exports and no copy-paste. The skill pulls your data straight from Databox through MCP each time it runs, so the report is always built from your live source.
Can agencies run this for multiple clients?
Yes — run it against each client's data connected in Databox, one account at a time, and you get the same structured weekly brief for every client. It's built to give a consistent report you can take to each client review.
Can I customize the report?
Yes. Before it runs, the skill asks a few onboarding questions — what you want to measure, the time frame, and any context that matters for the analysis — so the report is shaped to your goals from the start. After a run, you can give it feedback to adjust focus, sections, or anomaly thresholds, and reinstall the updated version so your changes carry into future runs.
Search & Traffic Performance Skills
Three free Claude skills, one complete picture — website performance, search rankings, and AI visibility, reported from
-

-

-

- +3
Set Baseline
Set an honest, seasonality-aware baseline for any metric before a campaign — a typical-range band with confidence.
Morning Marketing Summary
Pulls live data from all connected marketing channels via Databox and delivers a performance brief to Slack/email


