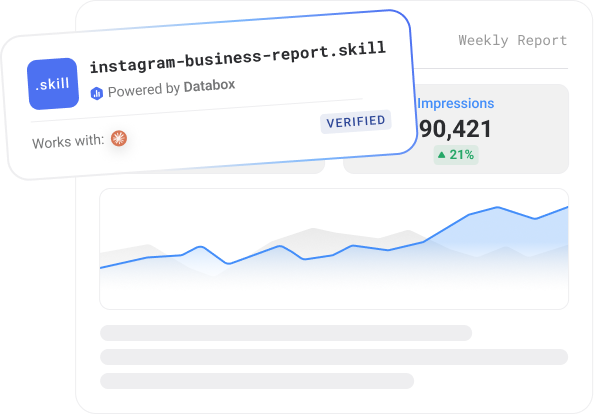
Instagram Business Performance Report
A Claude skill that connects to your Databox workspace via MCP and writes a structured Instagram Business profile performance report from live data.A Claude skill that connects to your Databox workspace via MCP and writes a structured Instagram Business profile performance report from live data. Covers reach, benchmarked engagement, follower growth, content mix by format, Reels and Stories sections, profile actions, audience demographics, and optional GA4 traffic from Instagram. Output: an 11-section HTML report in under 60 seconds.
- ~5 minutes setup
- Runs on demand
- Claude + Databox MCP
- Works with
- Claude
- Requires
- Databox account + Databox MCP
- Data source
- Google Analytics 4, Instagram Business
- Output
- HTML report
- Best for
- Growth teams, agencies, founders
- Setup time
- ~5 minutes
What it does
Most Instagram reviews stop at likes and follower count. This skill connects to your Databox workspace and writes a structured organic performance report from live Instagram Business data in a single run.
Connect your workspace, trigger the skill, and it reads live data from your Instagram Business profile and writes a report covering: an account snapshot with reach, impressions, profile visits, accounts engaged, interactions, new followers, and website clicks, each with a period-over-period delta; a six-month trend view across reach, engagement, and follower growth; engagement rate calculated by followers, with the composition of interactions broken out into likes, comments, saves, shares, and replies; follower growth with a monthly trend and growth rate; a content-mix breakdown showing how each post format is performing; a dedicated Reels section with plays, reach, average watch time, and saves; a dedicated Stories section with reach, replies, and navigation; a profile-actions section covering the taps that show the profile drove real action — website clicks, link taps, and contact taps; audience demographics by age, gender, country, and city; and optional website traffic from Instagram where GA4 is connected, with conversion rate compared to your site average.
The report separates saves and shares from likes, since those are the signals that earn distribution rather than just approval. Reels and Stories each get their own section rather than being folded into a single feed view — the way Instagram actually splits content.
On first run the skill confirms your Instagram data source, asks about your objective, follower size, industry, and reporting window, then saves the configuration permanently. Every subsequent run skips setup and goes straight to the data — output in under 60 seconds, replacing a manual Instagram Insights pull that typically takes 30–45 minutes per cycle.
No AI hallucinations. Analysis built on a real context layer.
Ask a generic AI to analyse your business performance and it will give you a confident answer. It will also be working from assumptions.
Generic AI doesn't know how your business defines a qualified lead, what your MRR calculation includes, or how you attribute revenue. It fills those gaps with the most plausible interpretation it can find — which is different from the correct one.
The products here run on Databox's data layer — if you choose so. Your metric definitions, your reporting logic, and your live numbers are what the AI reads, pulled straight through Databox MCP instead of uploaded by hand. That's the difference between an output you can share with your team and one you have to verify before you trust it.
Who it's for
What's in the package
Security scanned Reviewed by DataboxHow to use it
What you need to run this
Claude
Free to download. Required to install and run skills.
Databox account
The skill connects to your data in Databox. The 14-day trial and all paid plans include all integrations you need to use this skill.
MCP connection
Connector inside your Claude. Takes less than a minute to set up. Full instructions in the setup guide included in the download.
Free to start. Connect your first integration in minutes — no credit card required.
Connect any AI tool to your Databox data with Databox MCP.
Databox MCP is the bridge between your live metrics and any AI — Claude, ChatGPT, Cursor, or any client that speaks MCP. One auth, every workspace, no scraping.

Example output
Common questions
What does the Instagram Business Performance Report do?
It's a Claude skill that connects to your Databox workspace through MCP and writes a structured Instagram Business performance report from live data. It covers reach, benchmarked engagement rate, follower growth, Reels performance, Stories signals, content format breakdown, audience demographics, and optional GA4 website traffic - across a 10-section HTML report.
What data sources does it need?
Instagram Business, connected to your Databox account. Google Analytics 4 is optional - if connected, the report adds a section on website traffic and conversions from Instagram. The skill documents any metrics unavailable through Databox's integration, such as Story completion rate.
What's in the output?
A 10-section report covering: a performance snapshot with period deltas; 6-month trend charts for reach and interactions; engagement rate benchmarked against 2025-26 norms with a composition breakdown of likes, comments, saves, shares, and replies; follower growth rate vs benchmark; content mix and top posts by format; Reels performance with plays, reach, and avg watch time; Stories performance; profile actions including website clicks and link taps; audience demographics by age, gender, country, and city; and optional GA4 traffic and conversion contribution.
Do I need a Databox account to use this skill?
Yes, ideally — and here's why it matters. Point a generic AI at a raw data export and it has to guess what your numbers mean: which conversions count, how you define an engaged session, what a "normal" week looks like. It fills those gaps with the most plausible interpretation it can find, which is often not the correct one. The skill avoids that by reading your data live from Databox through MCP, where your metrics are already standardized — one consistent definition for sessions, engagement, and conversions across your setup. The AI reads what's actually true for your business instead of inferring it, so the report is one you can trust rather than verify. You can technically run it against data you've pasted in by hand, but you lose that context layer and the output is only as reliable as the export. If you don't have an account or data source connected yet, the skill walks you through the setup.
Do I need a paid Databox plan to run this skill?
The skill is free to download. Running it requires the Databox MCP connection, which isn't included on the forever free plan. Every new Databox account starts with a 14-day free trial that includes everything the skill needs — after that, any paid plan covers it, including the Analyst plan.
Does this use live data from my connected source?
Yes — every run reads your live data directly from Databox through the MCP connection. The report reflects your current data at the moment you run it, not a cached or uploaded snapshot.
Do I need to export data manually?
No — there are no CSV exports and no copy-paste. The skill pulls your data straight from Databox through MCP each time it runs, so the report is always built from your live source.
Can agencies run this for multiple clients?
Yes — run it against each client's data connected in Databox, one account at a time, and you get the same structured weekly brief for every client. It's built to give a consistent report you can take to each client review.
Can I customize the report?
Yes. Before it runs, the skill asks a few onboarding questions — what you want to measure, the time frame, and any context that matters for the analysis — so the report is shaped to your goals from the start. After a run, you can give it feedback to adjust focus, sections, or anomaly thresholds, and reinstall the updated version so your changes carry into future runs.
Search & Traffic Performance Skills
Three free Claude skills, one complete picture — website performance, search rankings, and AI visibility, reported from
-

-

-

- +3
Set Baseline
Set an honest, seasonality-aware baseline for any metric before a campaign — a typical-range band with confidence.
Morning Marketing Summary
Pulls live data from all connected marketing channels via Databox and delivers a performance brief to Slack/email


