Quick Financial Health Check
A Claude skill that connects to your Databox workspace via MCP and produces a monthly financial review for a services firm — pulling QuickBooks data (connected inside Databox) into a single self-contained HTML dashboard. It compares this month's P&L to the matched prior period and same period last year, projects four weeks of cash flow with stated assumptions, lays out AR/AP aging, and flags customers who were invoiced consistently then went quiet. Its discipline is the point: if a number isn't in the data, it shows a visible gap rather than guessing, and every metric pulled is logged with its sync freshness so you know exactly what the dashboard is built on.
- ~5 minutes setup
- Runs on demand
- Claude + Databox MCP
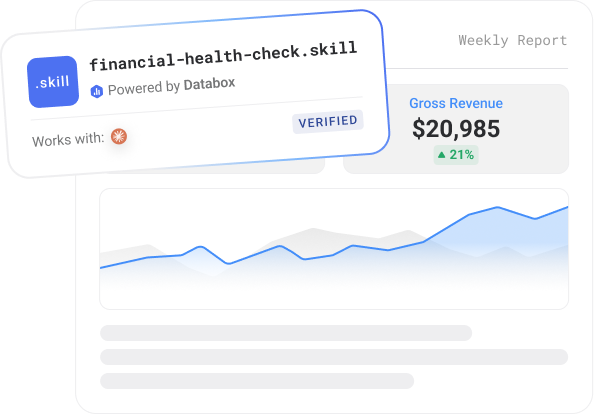
- Works with
- Claude
- Requires
- Databox account + Databox MCP
- Data source
- QuickBooks
- Output
- HTML report
- Best for
- Growth teams, agencies, founders
- Setup time
- ~5 minutes
What it does
Most owners and finance leads at services firms get their real financial picture late — when the bookkeeper sends the month-end report, or when cash gets tight enough to go looking. The numbers live in QuickBooks, but assembling them into a decision-ready read takes time nobody has, so it slips.
This skill turns that into a two-word monthly habit. Connect QuickBooks to Databox, trigger it, and it pulls your financials and builds a dashboard around what you actually care about: a P&L comparison against the matched prior period and last year, a four-week cash flow projection with DSO/DPO and stated assumptions, AR/AP aging, and a missing-invoice check that flags clients invoiced three months running who then went silent. On the first run it asks four quick questions — firm type, targets, other tracked metrics, and your single biggest financial concern — and leads the summary with whatever you said matters most.
What sets it apart is what it refuses to do. It never fills a missing number with an estimate — a gap renders as a visible “DATA GAPS” block, because a confident-looking wrong number is more dangerous than an honest blank. Every metric it pulls is recorded in a Data Source Disclosure Box with success/fail status and sync freshness, so the report discloses exactly what it’s built on. It can also answer quick receivables questions on the spot (“who’s overdue?”) and run unattended as a scheduled monthly task.
The output is a self-contained, print-friendly HTML dashboard. Because it contains real customer names and financial figures, it carries a confidentiality note — share it deliberately.
No AI hallucinations. Analysis built on a real context layer.
Ask a generic AI to analyse your business performance and it will give you a confident answer. It will also be working from assumptions.
Generic AI doesn't know how your business defines a qualified lead, what your MRR calculation includes, or how you attribute revenue. It fills those gaps with the most plausible interpretation it can find — which is different from the correct one.
The products here run on Databox's data layer — if you choose so. Your metric definitions, your reporting logic, and your live numbers are what the AI reads, pulled straight through Databox MCP instead of uploaded by hand. That's the difference between an output you can share with your team and one you have to verify before you trust it.
Who it's for
What's in the package
Security scanned Reviewed by DataboxHow to use it
Example prompts you can ask Claude
What you need to run this
Claude
Free to download. Required to install and run skills.
Databox account
The skill connects to your data in Databox. The free plan includes all integrations you need to use this skill.
MCP connection
Connector inside your Claude. Takes less than a minute to set up. Full instructions in the setup guide included in the download.
Free to start. Connect your first integration in minutes — no credit card required.
Connect any AI tool to your Databox data with Databox MCP.
Databox MCP is the bridge between your live metrics and any AI — Claude, ChatGPT, Cursor, or any client that speaks MCP. One auth, every workspace, no scraping.

Example output
Common questions
What does the Quick Financial Health Check do?
It's a Claude skill that connects to your Databox workspace through MCP and turns your QuickBooks data into a monthly financial dashboard for a services firm — P&L comparison, four-week cash flow, AR/AP aging, missing-invoice alerts, and a target scorecard. It leads with your stated biggest concern and shows visible gaps wherever data is missing rather than guessing.
What data sources does it need?
QuickBooks Online, connected as a data source inside your Databox account — the skill reads everything through the Databox MCP and never calls QuickBooks directly. It discovers and confirms your exact metric keys at runtime, so it adapts to your account; anything it can't find is reported as a data gap.
What's in the output?
A self-contained, print-friendly HTML dashboard: a Data Source Disclosure Box (every metric pulled, with sync freshness), an optional target scorecard, an executive summary led by your biggest concern, a P&L comparison, a four-week cash flow outlook, AR/AP aging, alerts (missing invoices and material changes), and prioritized next steps. Aggregate AR is reported at the dashboard level, with customer-level detail noted as a limitation.
Do I need a Databox account to use this skill?
Yes, ideally — and here's why it matters. Point a generic AI at a raw data export and it has to guess what your numbers mean: which conversions count, how you define an engaged session, what a "normal" week looks like. It fills those gaps with the most plausible interpretation it can find, which is often not the correct one. The skill avoids that by reading your data live from Databox through MCP, where your metrics are already standardized — one consistent definition for sessions, engagement, and conversions across your setup. The AI reads what's actually true for your business instead of inferring it, so the report is one you can trust rather than verify. You can technically run it against data you've pasted in by hand, but you lose that context layer and the output is only as reliable as the export. If you don't have an account or data source connected yet, the skill walks you through the setup.
Can I use this with the free Databox plan?
Yes — the free Databox plan includes the integration this skill needs, so you can run it at no cost. The skill itself is also free to download.
Does this use live data from my connected source?
Yes — every run reads your live data directly from Databox through the MCP connection. The report reflects your current data at the moment you run it, not a cached or uploaded snapshot.
Do I need to export data manually?
No — there are no CSV exports and no copy-paste. The skill pulls your data straight from Databox through MCP each time it runs, so the report is always built from your live source.
Can agencies run this for multiple clients?
Yes — run it against each client's data connected in Databox, one account at a time, and you get the same structured weekly brief for every client. It's built to give a consistent report you can take to each client review.
Can I customize the report?
Yes. Before it runs, the skill asks a few onboarding questions — what you want to measure, the time frame, and any context that matters for the analysis — so the report is shaped to your goals from the start. After a run, you can give it feedback to adjust focus, sections, or anomaly thresholds, and reinstall the updated version so your changes carry into future runs.
Morning Marketing Summary
Pulls live data from all connected marketing channels via Databox and delivers a performance brief to Slack/email
Content Performance Partner
Every published page sorted into keep, refresh, or retire — a prioritized monthly editorial work queue written from live
Sales Pulse
Pipeline analysis before charts. Reads your CRM through Databox and tells you what's healthy, what's slipping, and where
-

-

-

- +1


