
Stripe Revenue & Payments Report
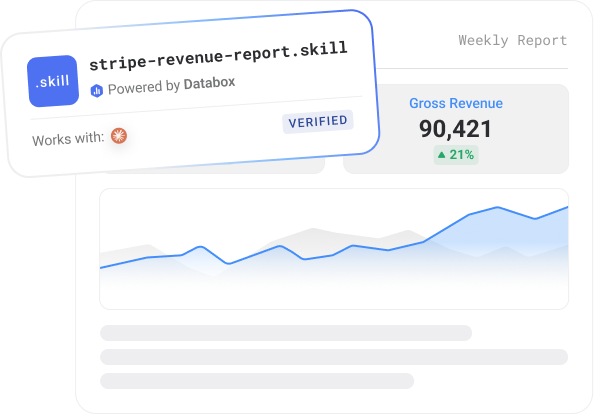
A Claude skill that connects to your Databox workspace via MCP and writes a structured Stripe revenue and payments report from live data. Output: a six-section HTML report covering MRR movement, new and expansion revenue, refunds, failed payments, top customers or plans by revenue, and one prioritized action - in under 60 seconds
~5 minutes setup
Runs on demand
Claude + Databox MCP
How to use it
Step 1
Download the skill
Click Get it free above. The skill file downloads to your machine.
Step 2
Install in Claude
Open Claude Desktop → Settings → Skills → Install from file. Select the downloaded file.
Step 3
Connect Databox
The skill prompts you to connect your Databox account using the connector. This takes less than a minute, and you'll need a free Databox account.
Step 4
Trigger on demand
Type the trigger phrase in Claude — listed in the setup guide. The skill runs against your live Databox data and returns the output.
More about it
Example report
What does the Stripe Revenue & Payments Report do?
- Works with
- Claude and Databox
- Requires
- Databox account + Databox MCP
- Data source
- Stripe
- Output
- HTML report
- Best for
- Growth teams, agencies, founders
- Setup time
- ~5 minutes
Stripe’s dashboard shows you revenue. It doesn’t tell you why it moved, what’s driving refunds, or whether failed payments are above the threshold worth investigating. Getting that picture requires cross-referencing the Payments, Subscriptions, and Disputes views manually – or exporting and building it yourself.
This skill reads live Stripe data from your Databox workspace and writes a structured report covering the dimensions that matter for a standing revenue review. It surfaces MRR with a period-over-period delta and direction; new revenue from new subscribers or one-time charges; refund volume and refund rate flagged against a 2% threshold; failed payment rate as a revenue recovery signal; and top revenue sources broken down by product, plan, or customer where dimensional data is available.
For SaaS teams, the MRR movement section connects new revenue, expansion, contraction, and churn in a single view – the standard MRR waterfall most founders check manually at month-end. For ecommerce or service businesses, the focus shifts to gross revenue, refund rate, and dispute volume.
On first run the skill asks about your business model (subscription vs. one-time) and revenue target, then saves the configuration. Every subsequent run is a single trigger.
What metrics it analyzes
-
 Refunds
-
Fees
-
Paid Invoices Amount
-
Open Invoices
-
Overdue Invoices Amount
-
MRR
-
Net MRR
-
New MRR
-
Churned MRR
-
MRR Upgrades
-
MRR Downgrades
-
ARR
-
Net ARR
-
Active Subscriptions
-
Net Active Subscriptions
-
New Subscriptions
-
New Subscriptions incl. Trials
-
New Customers
-
Total Customers
-
Churned Customers
-
Upgrades
-
Downgrades
-
New Trials
-
Active Trials
-
Net Active Trials
-
Trial Conversion Rate
-
plan
Who it’s for
Heads of growth and operators
You run the numbers on Monday. This replaces the 20 minutes of tab-switching with a brief that is ready before your standup.
Agency analysts
Run it for each client. Get a consistent read on every account in the time it used to take to review one.
Founders doing their own analytics
You know what your metrics are. This tells you what they mean and what to do about it.
What’s in the package
Security scanned Reviewed by Databoxstripe-revenue-report-setup-guide.pdf
MCP connection steps, configuration options, example run
stripe-revenue-report.skill
Install file for Claude
Report structure
Every run produces a structured report with these sections:
- Verdict Bar
- Report Header
- Executive Scorecard
- MRR Waterfall [SaaS/Hybrid]
- Churn Analysis [SaaS/Hybrid]
- Plan Mix & Subscription Health [SaaS/Hybrid]
- Payment Health
- Gross Volume & Refunds [Ecommerce / all models]
- 6-Month Trend
- Action Items
What you need to run this
Claude
Free to download. Required to install and run skills.
Databox account
The skill connects to your data in Databox. The 14-day trial and all paid plans include all integrations you need to use this skill.
MCP connection
Connector inside your Claude. Takes less than a minute to set up. Full instructions in the setup guide included in the download.
Don't have Databox yet?
Free to start. Connect your first integration in minutes — no credit card required.
Built on Databox
No AI hallucinations. Analysis built on a real context layer.
Ask a generic AI to analyse your business performance and it will give you a confident answer. It will also be working from assumptions.
Generic AI doesn't know how your business defines a qualified lead, what your MRR calculation includes, or how you attribute revenue. It fills those gaps with the most plausible interpretation it can find — which is different from the correct one.
The products here run on Databox's data layer — if you choose so. Your metric definitions, your reporting logic, and your live numbers are what the AI reads, pulled straight through Databox MCP instead of uploaded by hand. That's the difference between an output you can share with your team and one you have to verify before you trust it.
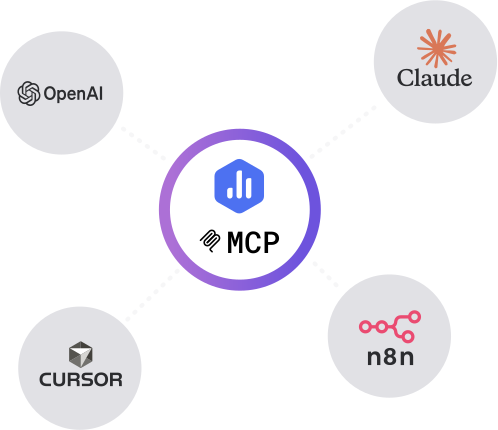
Connect any AI tool to your Databox data with Databox MCP.
Databox MCP is the bridge between your live metrics and any AI — Claude, ChatGPT, Cursor, or any client that speaks MCP. One auth, every workspace, no scraping.
Stay updated with new AI products
New skills, prompts, agents, and bundles ship every few weeks. Get them in your inbox.
More like this
Built by
Executive Decision Brief
Turn your connected metrics into a one-page leadership briefing in minutes.
Works with
Claude
GA4 Website Traffic & Performance Report
Your weekly GA4 brief - sessions, channels, top pages, conversions, and anomaly flags - written from live Databox data.

Works with
Claude
Ecommerce Sales & Conversion Report
Shopify and GA4 in one report - sales, top products, abandoned checkouts, and conversion rate from live Databox data.

Works with
Claude
SEO Performance & Visibility Report
GSC, GA4, and your SEO platform in one report - rankings, backlinks, conversions, and CTR opportunities from live data.


Works with
Claude
Common questions
What does the Stripe Revenue & Payments Report do?
It's a Claude skill that connects to your Databox workspace through MCP and writes a structured Stripe revenue and payments report from live data. It covers total revenue, MRR movement, payment health, refunds and disputes, and subscriber movement - adapted for subscription or ecommerce business models depending on what Stripe data is connected.
What data sources does it need?
Stripe, connected to your Databox account. That's the only source this skill reads from. The report adapts its structure based on whether subscription metrics like MRR and subscriber counts are available.
What's in the output?
A report covering: a revenue snapshot with total revenue, MRR, and charges vs prior period; MRR movement broken into new, expansion, contraction, and churned MRR with net change named; payment health with failed payment rate flagged if above 5%; refund amount, refund rate, and dispute count with a flag if refund rate exceeds 2%; and subscriber movement showing new, churned, and net change vs total active.
Do I need a Databox account to use this skill?
Yes, ideally — and here's why it matters. Point a generic AI at a raw data export and it has to guess what your numbers mean: which conversions count, how you define an engaged session, what a "normal" week looks like. It fills those gaps with the most plausible interpretation it can find, which is often not the correct one. The skill avoids that by reading your data live from Databox through MCP, where your metrics are already standardized — one consistent definition for sessions, engagement, and conversions across your setup. The AI reads what's actually true for your business instead of inferring it, so the report is one you can trust rather than verify. You can technically run it against data you've pasted in by hand, but you lose that context layer and the output is only as reliable as the export. If you don't have an account or data source connected yet, the skill walks you through the setup.
Do I need a paid Databox plan to run this skill?
The skill is free to download. Running it requires the Databox MCP connection, which isn't included on the forever free plan. Every new Databox account starts with a 14-day free trial that includes everything the skill needs — after that, any paid plan covers it, including the Analyst plan.
Does this use live data from my connected source?
Yes — every run reads your live data directly from Databox through the MCP connection. The report reflects your current data at the moment you run it, not a cached or uploaded snapshot.
Do I need to export data manually?
No — there are no CSV exports and no copy-paste. The skill pulls your data straight from Databox through MCP each time it runs, so the report is always built from your live source.
Can agencies run this for multiple clients?
Yes — run it against each client's data connected in Databox, one account at a time, and you get the same structured weekly brief for every client. It's built to give a consistent report you can take to each client review.
Can I customize the report?
Yes. Before it runs, the skill asks a few onboarding questions — what you want to measure, the time frame, and any context that matters for the analysis — so the report is shaped to your goals from the start. After a run, you can give it feedback to adjust focus, sections, or anomaly thresholds, and reinstall the updated version so your changes carry into future runs.