
Executive Decision Brief
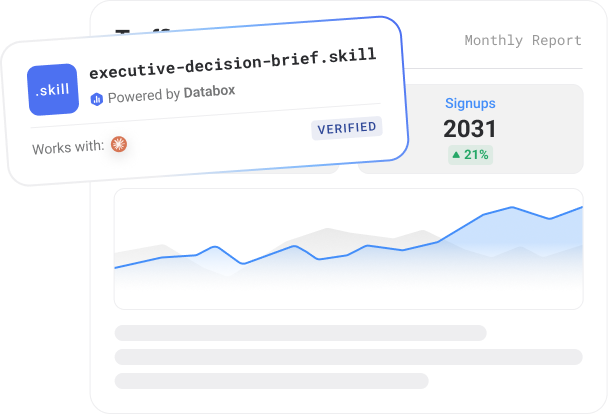
A Claude skill that reads whatever you have connected in Databox and turns it into a one-page executive briefing: the headline story, key movements, wins, risks, and three "should we" decisions — a visual HTML report a CEO can skim in 90 seconds.
~5 minutes setup
Runs on demand
Claude + Databox MCP

Built by
Computan
Computan is a Canada-based web development and HubSpot solutions company that partners with marketing agencies, e-commerce businesses, and non-profits as a white label WordPress development and HubSpot CRM consulting team, handling the build, integration, and ongoing upkeep of their digital platforms.
How to use it
Step 1
Download the skill
Click Get it free above. The skill file downloads to your machine.
Step 2
Install in Claude
Open Claude Desktop → Settings → Skills → Install from file. Select the downloaded file.
Step 3
Connect Databox
The skill prompts you to connect your Databox account using the connector. This takes less than a minute, and you'll need a free Databox account.
Step 4
Trigger on demand
Type the trigger phrase in Claude — listed in the setup guide. The skill runs against your live Databox data and returns the output.
Built on Databox
No AI hallucinations. Analysis built on a real context layer.
Ask a generic AI to analyse your business performance and it will give you a confident answer. It will also be working from assumptions.
Generic AI doesn't know how your business defines a qualified lead, what your MRR calculation includes, or how you attribute revenue. It fills those gaps with the most plausible interpretation it can find — which is different from the correct one.
The products here run on Databox's data layer — if you choose so. Your metric definitions, your reporting logic, and your live numbers are what the AI reads, pulled straight through Databox MCP instead of uploaded by hand. That's the difference between an output you can share with your team and one you have to verify before you trust it.
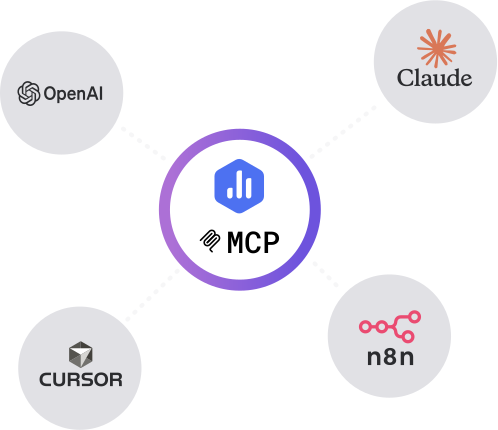
Connect any AI tool to your Databox data with Databox MCP.
Databox MCP is the bridge between your live metrics and any AI — Claude, ChatGPT, Cursor, or any client that speaks MCP. One auth, every workspace, no scraping.
Stay updated with new AI products
New skills, prompts, agents, and bundles ship every few weeks. Get them in your inbox.
More like this
AEO Report
Maps your brand's visibility across ChatGPT, Gemini, Perplexity, Copilot, and others - built from live GSC and GA4 data.


Works with
Claude
GA4 Website Traffic & Performance Report
Your weekly GA4 brief - sessions, channels, top pages, conversions, and anomaly flags - written from live Databox data.
Works with
Claude
Stripe Revenue & Payments Report
MRR, new revenue, churn, refunds, and failed payments - your Stripe report written from live Databox data.

Works with
Claude
SEO Performance & Visibility Report
GSC, GA4, and your SEO platform in one report - rankings, backlinks, conversions, and CTR opportunities from live data.


Works with
Claude
Common questions
What does the Executive Decision Brief skill do?
It connects to your Databox workspace via MCP and turns your connected metrics into a one-page leadership briefing — an Executive Takeaway, key movements, wins, risks, contradictions, discussion questions, and three "Should we…" decisions — as a visual HTML report readable in about 90 seconds. It analyzes and prioritizes rather than dumping metrics.
Which data sources does the skill need?
Whatever you have connected in Databox — it adapts to your sources (GA4, HubSpot, Stripe, QuickBooks, ad platforms, CRM, and more) and needs at least one revenue or core-KPI metric to anchor the brief. It never requires every source and never mentions a missing platform unless it would materially change the read.
Is it a dashboard?
No, it's a decision brief. It connects related metrics, surfaces contradictions, assigns confidence levels, and frames discussion-ready decisions. Charts appear only where a trend or breakdown adds insight a single number can't, so the report stays skimmable.
Do I need a Databox account to use this skill?
Yes, ideally — and here's why it matters. Point a generic AI at a raw data export and it has to guess what your numbers mean: which conversions count, how you define an engaged session, what a "normal" week looks like. It fills those gaps with the most plausible interpretation it can find, which is often not the correct one. The skill avoids that by reading your data live from Databox through MCP, where your metrics are already standardized — one consistent definition for sessions, engagement, and conversions across your setup. The AI reads what's actually true for your business instead of inferring it, so the report is one you can trust rather than verify. You can technically run it against data you've pasted in by hand, but you lose that context layer and the output is only as reliable as the export. If you don't have an account or data source connected yet, the skill walks you through the setup.
Do I need a paid Databox plan to run this skill?
The skill is free to download. Running it requires the Databox MCP connection, which isn't included on the forever free plan. Every new Databox account starts with a 14-day free trial that includes everything the skill needs — after that, any paid plan covers it, including the Analyst plan.
Does this use live data from my connected source?
Yes — every run reads your live data directly from Databox through the MCP connection. The report reflects your current data at the moment you run it, not a cached or uploaded snapshot.
Do I need to export data manually?
No — there are no CSV exports and no copy-paste. The skill pulls your data straight from Databox through MCP each time it runs, so the report is always built from your live source.
Can agencies run this for multiple clients?
Yes — run it against each client's data connected in Databox, one account at a time, and you get the same structured weekly brief for every client. It's built to give a consistent report you can take to each client review.
Can I customize the report?
Yes. Before it runs, the skill asks a few onboarding questions — what you want to measure, the time frame, and any context that matters for the analysis — so the report is shaped to your goals from the start. After a run, you can give it feedback to adjust focus, sections, or anomaly thresholds, and reinstall the updated version so your changes carry into future runs.