Product updates
new
Connect Databox to Your AI Tools
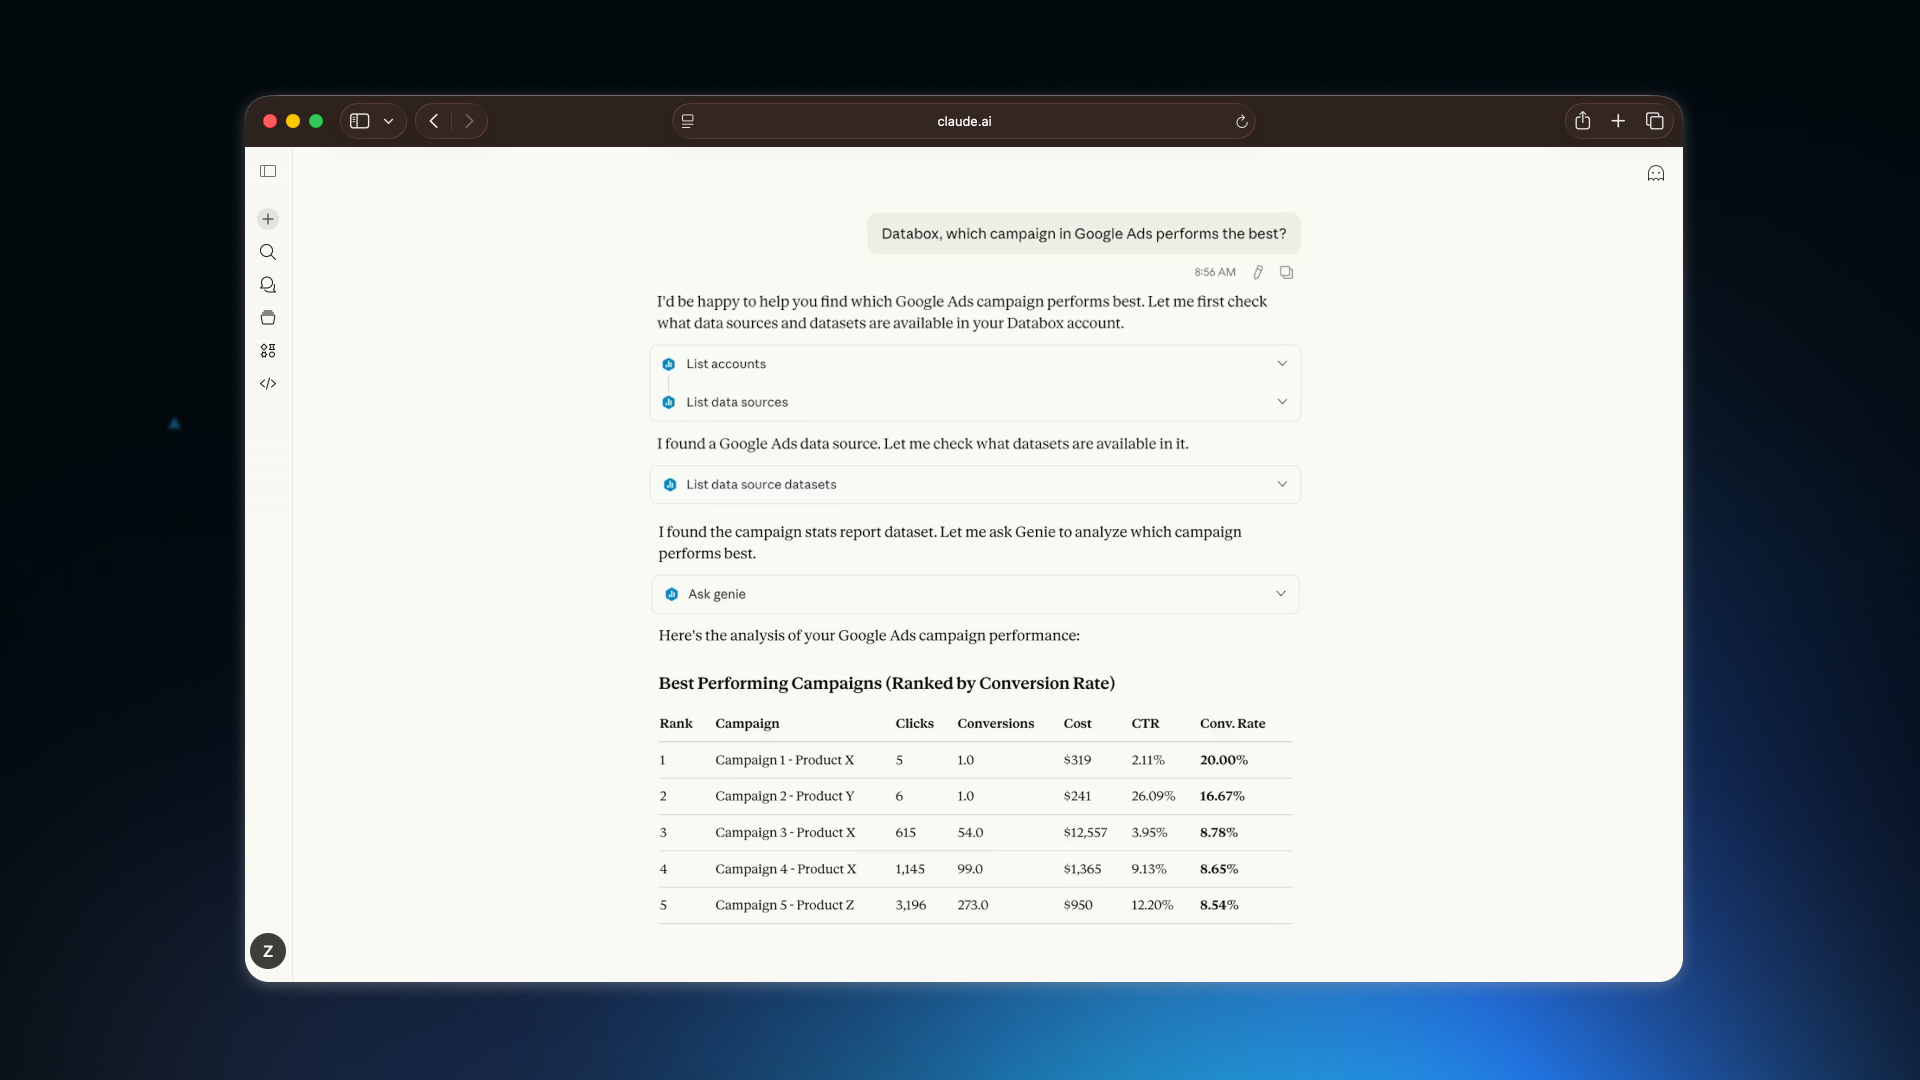
Connect Databox to tools like Claude, ChatGPT, n8n, and more, so you can answer questions faster, and act on them immediately.
- Ask questions and get reliable answers instantly, grounded in the metrics, definitions, and historical context your team already trusts
- Combine Databox data with information from other tools in the same conversation to understand what’s driving performance, without exporting or reworking data
- Move from insight to action faster by triggering workflows, alerts, and summaries automatically when performance changes
- Meet your team where they already work, so insights show up inside the AI tools and workflows they use every day
new
350+ New Integrations Unlocked with Dataddo
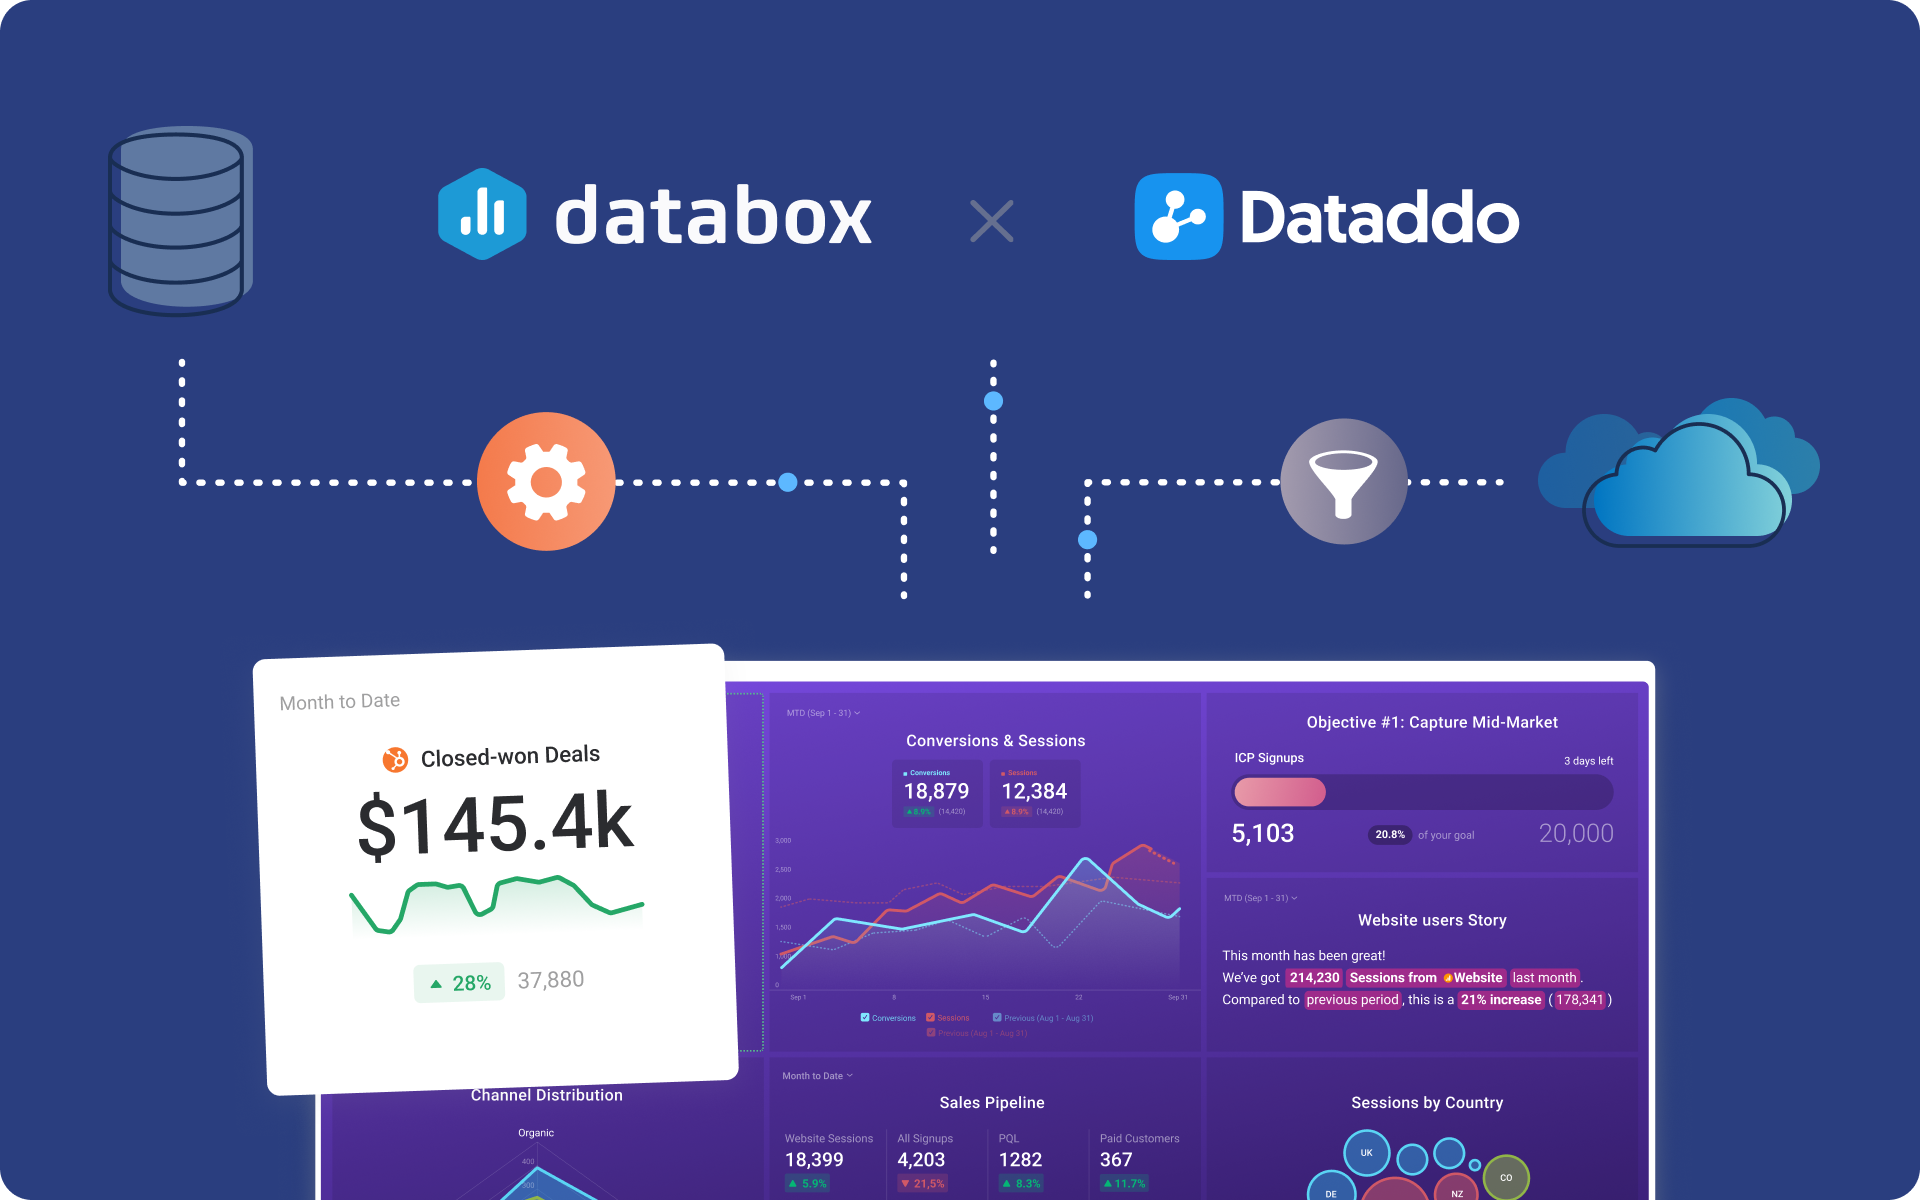
Now, you can connect Dataddo, a no-code data integration platform, directly to Databox to sync and prepare data from 350+ tools for analysis.
With Dataddo and Databox, you can:
- Bring in data from anywhere: Connect 350+ additional tools, like Amazon Advertising, Monday.com, Adroll, Asana, and many more!
- Make more of your data analysis-ready: All Dataddo-synced sources are dataset-compatible, so you can clean, merge, and format data before it powers your reports and custom metrics.
- Build custom metrics that reflect your business: Merge datasets and calculate columns to create metrics aligned with your team’s goals, processes, and definitions of success.
- Give every stakeholder the full picture: Whether you’re blending data across departments or sharing reports with execs, your dashboards and reports will include everything that matters.
new
Bring Internal Data Into Dashboards Your Team Actually Uses

Now, you can connect popular cloud databases and warehouses, like Amazon RDS, Aurora, Oracle, and MariaDB, directly to Databox, making your backend data accessible to the teams who need it most.
- Make key data accessible: Bring internal system data into Databox, prepare it for analysis, and add it to dashboards your team can actually use.
- Monitor metrics in real-time: Track product, finance, or operational performance as it happens.
- Unify reporting across systems: Combine backend data with CRM, marketing, and support metrics to get a more complete picture of performance.
new
Bring In Any Data From Any Source, With The New API
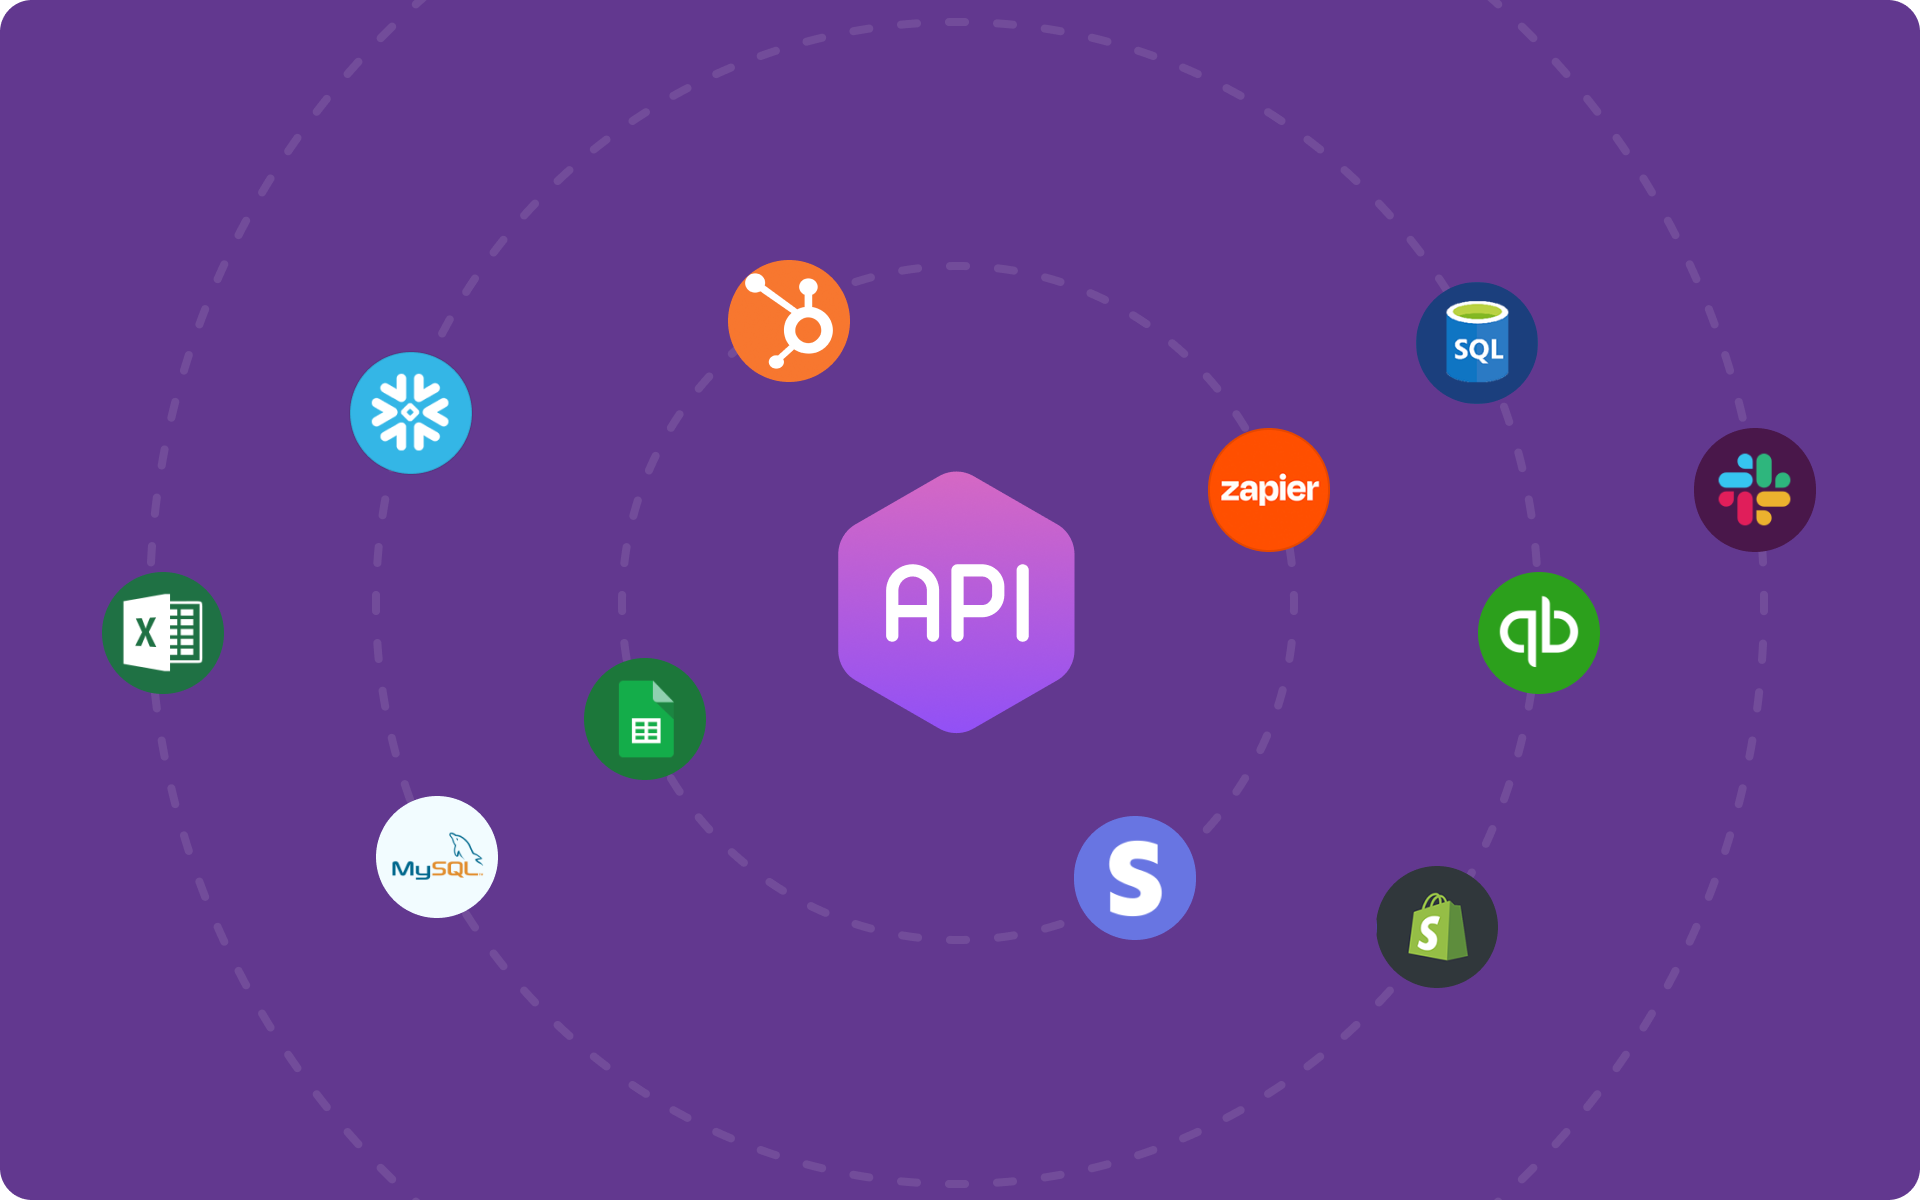
With Databox’s new API, you can now send structured, raw data from any source directly into Databox, so you can centralize more of your business data and help your team make faster, more informed decisions.
- Centralize all your key data: Send raw, row-level data from any internal system and use datasets to prepare it for analysis.
- Create custom metrics that track what matters: Slice, filter, and format your data to report on your most important metrics.
- Analyze and act faster: Filter dashboards by dimensions, drill into row-level details, and monitor goals in real time. Combine your custom data with metrics from other tools to uncover insights across teams and systems.
improvement
Plan More Confidently for the Future
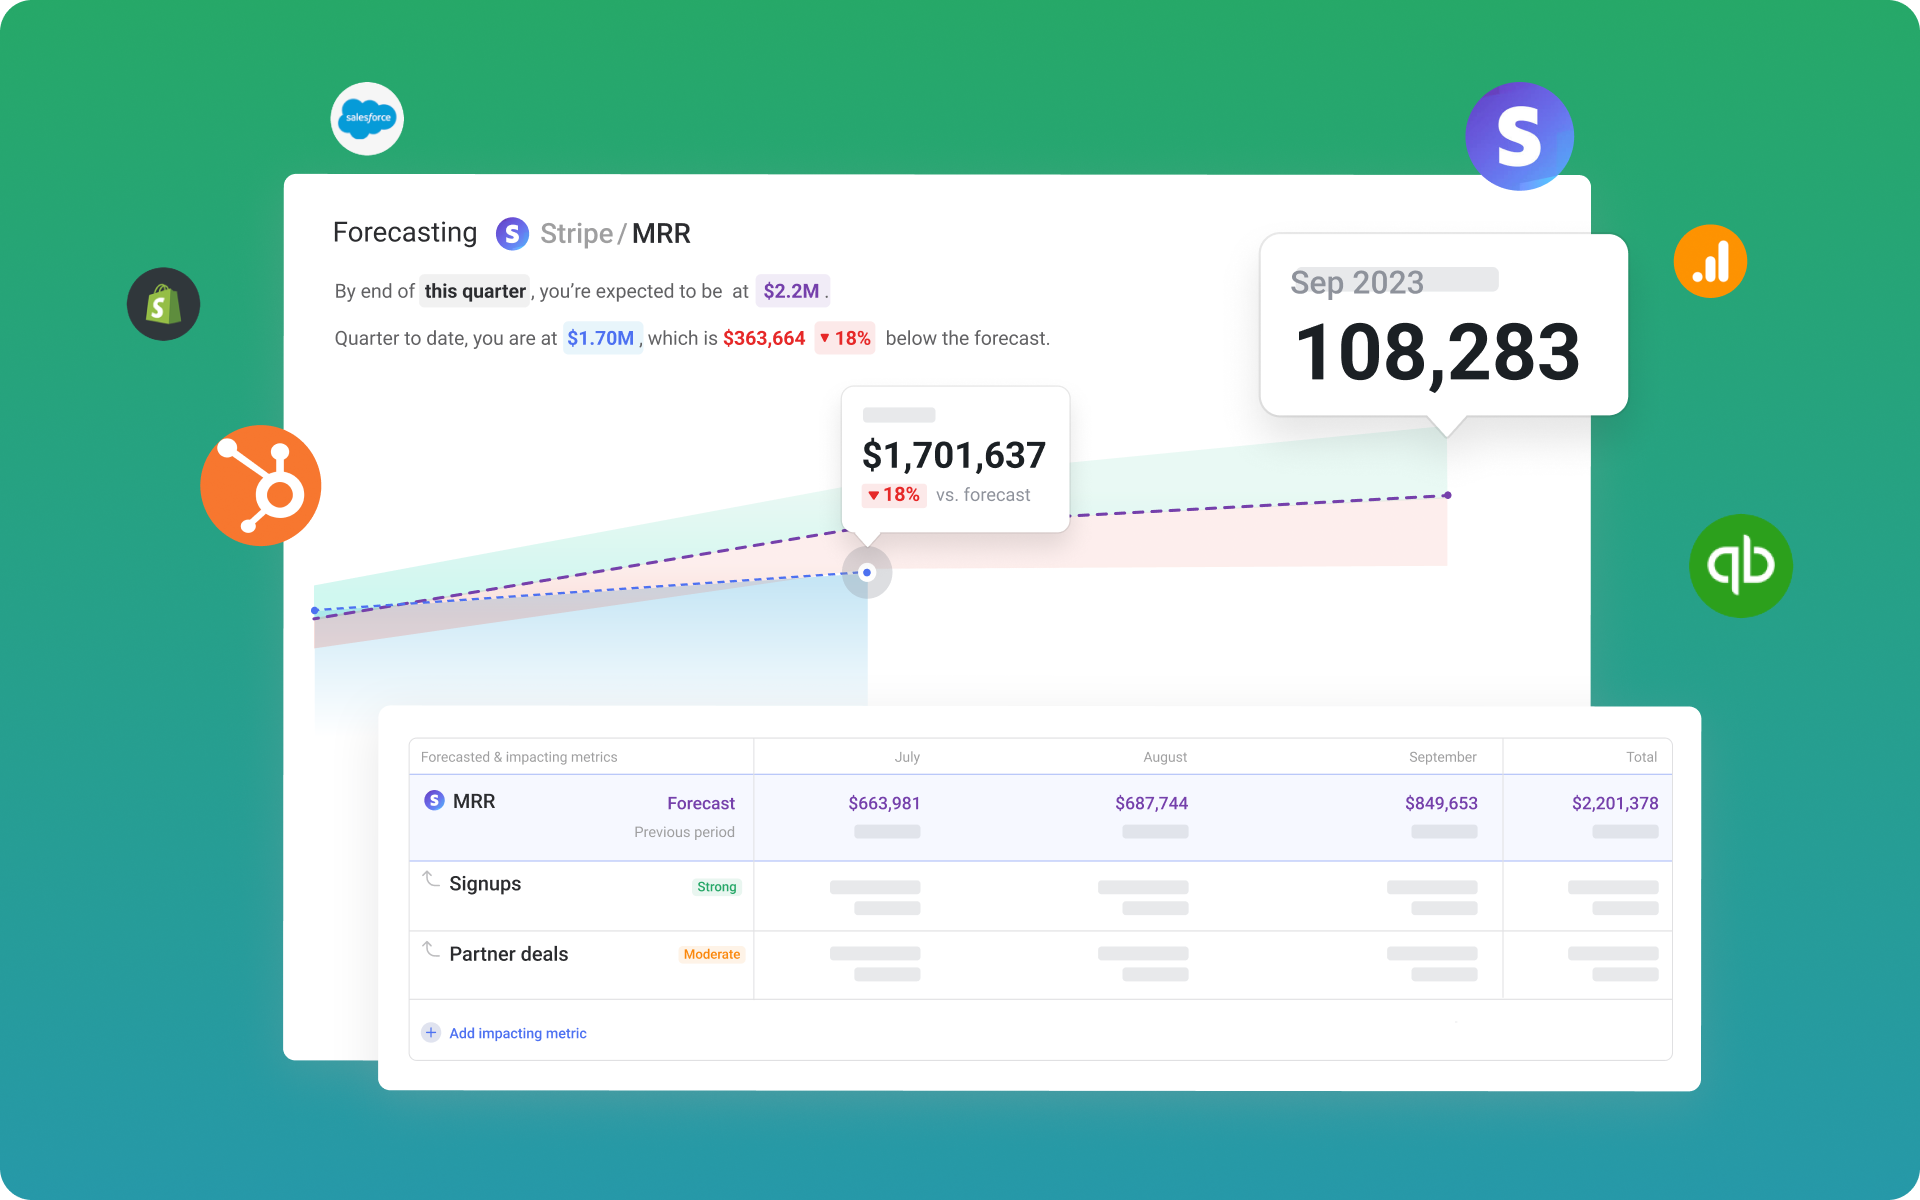
Now, when building your forecasts, you can factor in the metrics that influence your main KPI, so you can identify what’s driving results and plan with more confidence.
- Understand what drives performance: Add the metrics that impact your main KPI to uncover which factors have the greatest influence on your results.
- Validate your assumptions before committing: Model increases or decreases in key metrics to see how different plans could play out and choose the most realistic path forward.
- Choose the right method for your data: From trend-based to regression or smoothing models, select the forecasting approach that best fits your business.
For example, if your team is forecasting Monthly Recurring Revenue (MRR), you can add metrics like New MRR, Churn Rate, and Expansion MRR to see how each one affects your forecast. Then, model a 2% drop in churn to understand how that change could impact MRR and set targets your team can confidently deliver on.
new
Turn Your Strategy Into Measurable Results With OKRs
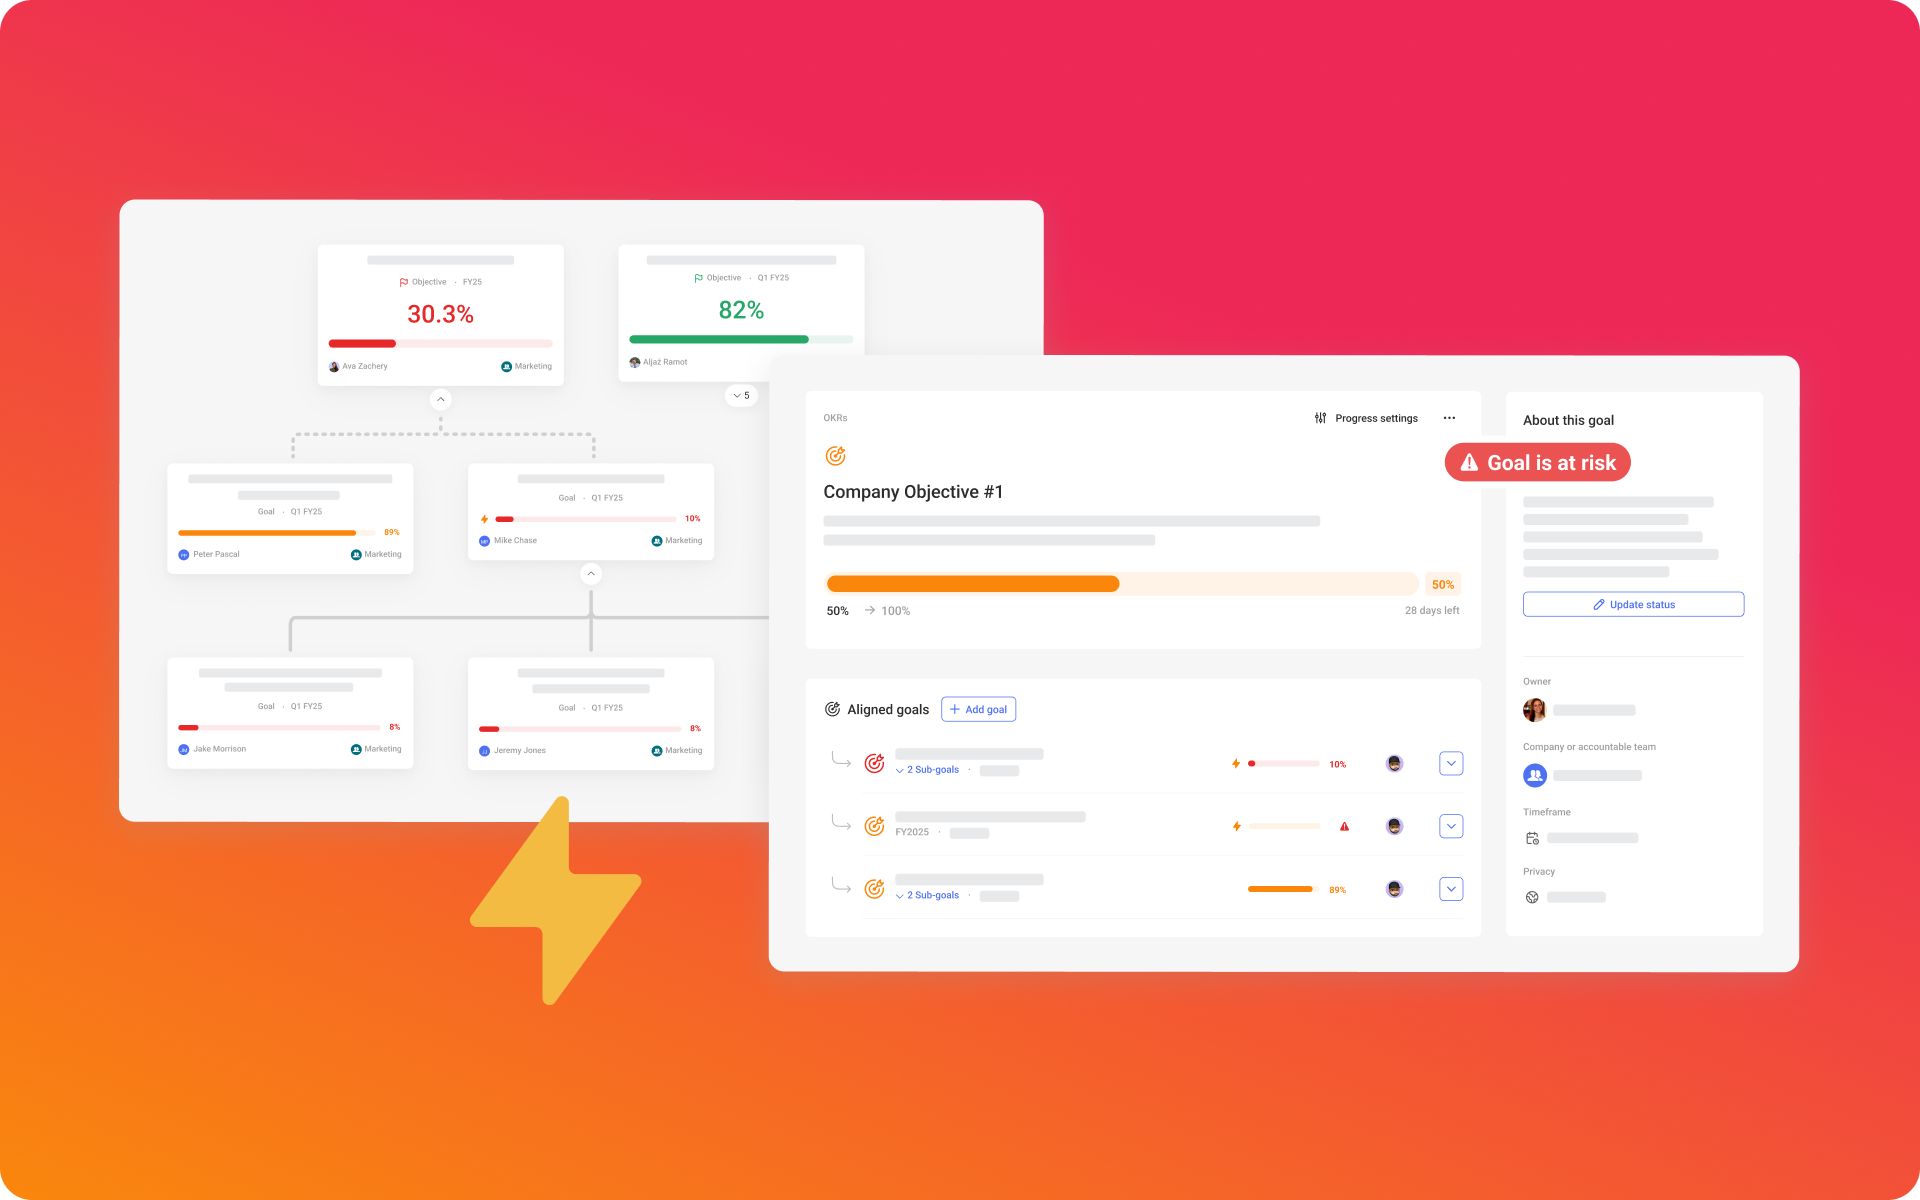
Now, you can build and track OKRs in Databox to keep every team aligned, accountable, and focused on the work that drives results.
- Clarify your strategy: Capture your company’s mission, vision, and long-term ambitions to guide what matters most.
- Align every team: Define high-level objectives, then break them down into measurable goals and sub-goals with clear ownership.
- Measure progress automatically: Link goals to the metrics you already track in Databox to keep performance visible and up to date.
- Add context to updates: Include notes and status updates to explain results, celebrate wins, and highlight what needs attention.
Want to learn more about OKRs and how to use them in Databox? Read the blog.
improvement
Apply Multiple Filters to Your Databoards and Uncover Insights Faster

Now, when visualizing metrics created from a dataset, you can apply multiple filter conditions to your Databoards to quickly explore performance across different views.
- Focus in on the right view: Add multiple filters to individual Datablocks or entire Databoards to focus on what matters.
- Refine your analysis: Use operators like Is, Is Not, Contains, and more to filter your data exactly how you need.
- Get answers quickly: Once you’ve applied your filters, click into the metric to see the raw, row-level data behind it – already filtered based on your selection.
- Work faster, without extra setup: Apply or adjust filters on the fly without creating new metrics, new Databoards, or changing your original configuration.
improvement
Get More Context Automatically in Your AI Performance Summaries
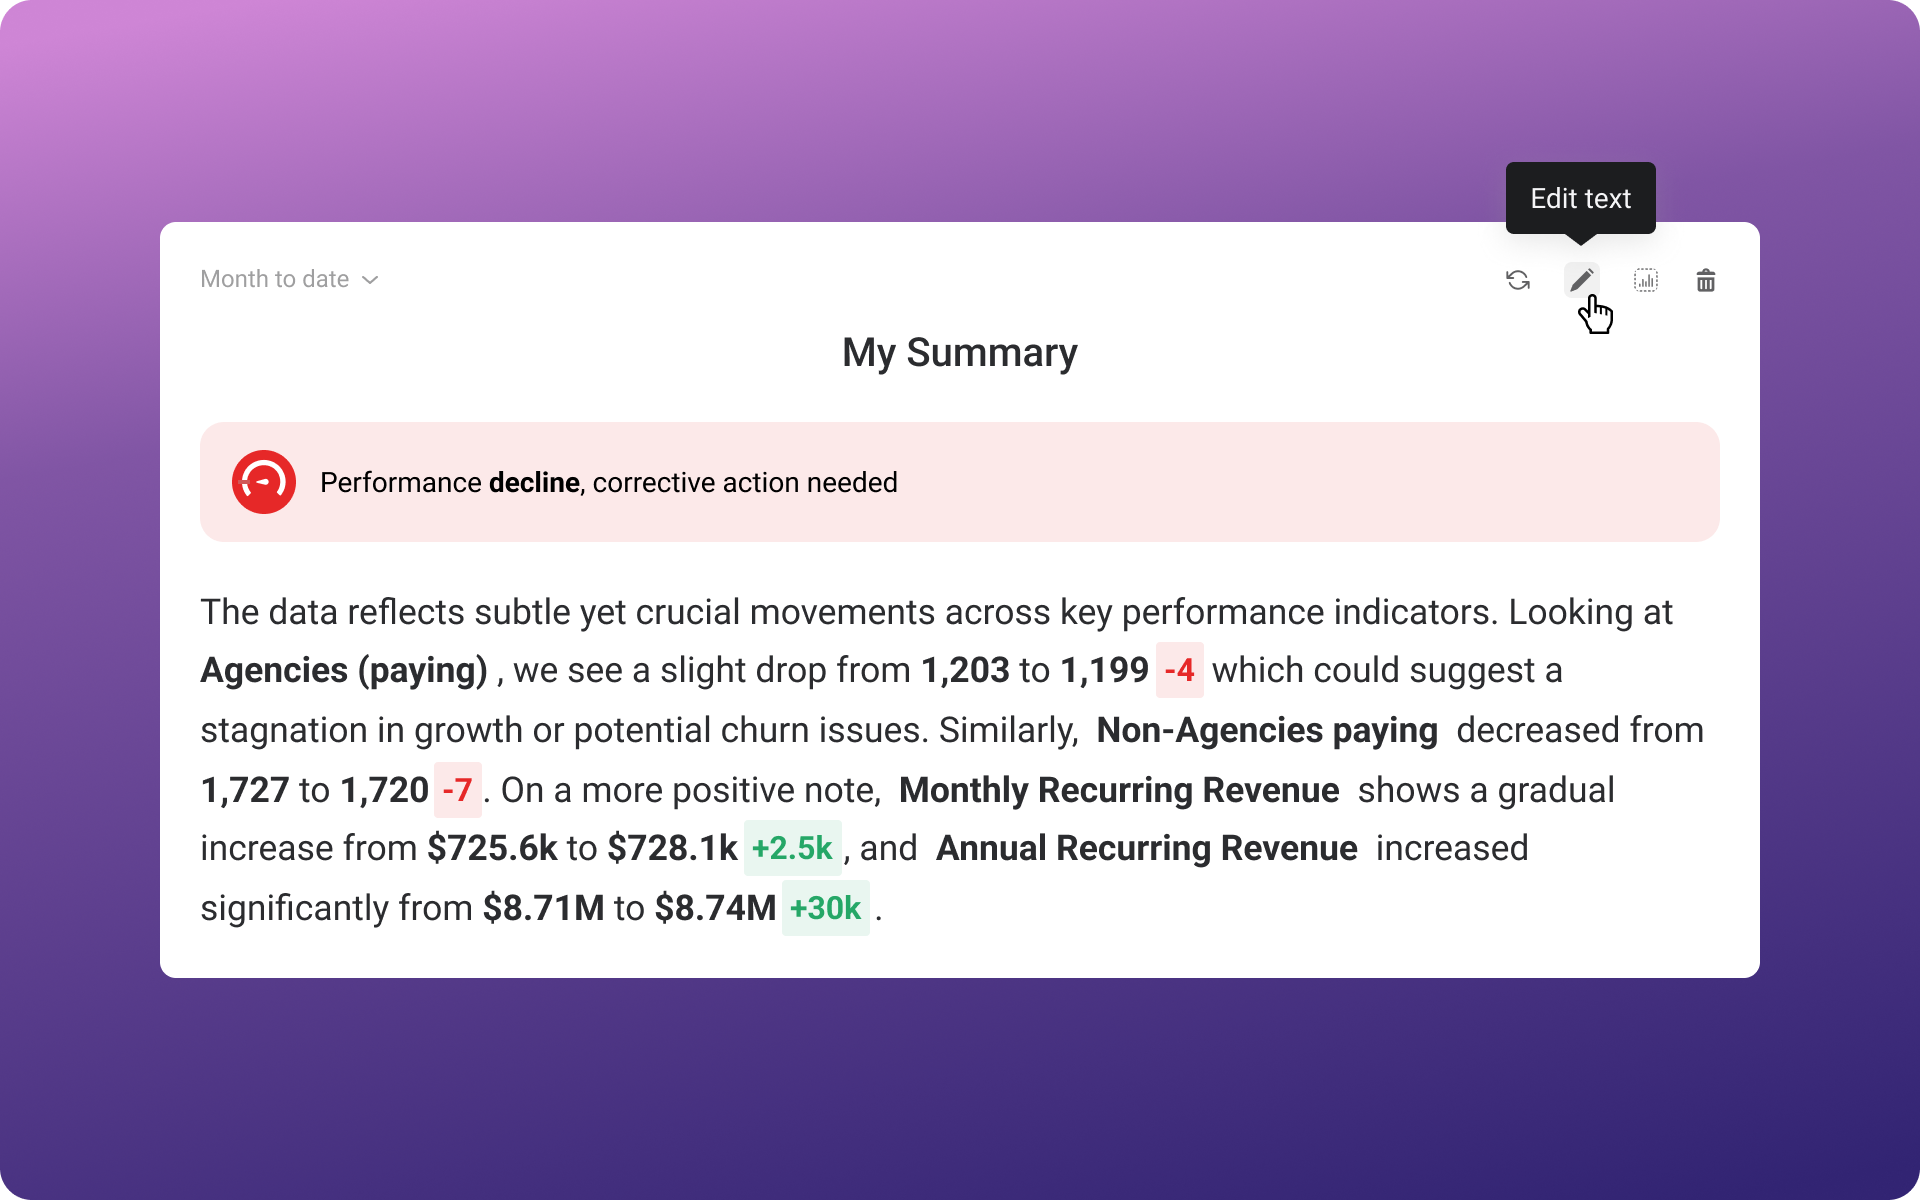
Performance Summaries will now automatically include additional data points like goals, forecasts, benchmarks, average values, and more, to give you richer context and more relevant recommendations.
For example, you’ll get a clear, written explanation of your progress toward goals, along with insights into key trends and changes, making it easier for stakeholders to understand your results.
data integrations
New Dataset Integration: Zendesk
Bring your Zendesk data into Databox, build the exact metrics your support team needs, and do deeper analysis.
- Build datasets: Select the specific object, like tickets, users, or posts, you want to analyze. Prepare the data for more reliable reporting.
- Merge datasets: Combine Zendesk data with data from other tools to analyze performance in context.
- Create custom metrics: Apply dimensions and filters to save the exact version of the metric you need.
- Visualize and analyze performance: Create Databoards that combine Zendesk data with metrics from other tools. Then, break down and filter by dimensions, compare trends over time, and drill into the row-level details.
- Set and track goals: Choose the metrics you want to improve, like faster replies or fewer tickets, and track your progress in real-time.
improvement
New Dataset Integrations: Google Sheets and Excel
Now, you can use Google Sheets and Excel with datasets, giving you the ability to prepare your spreadsheet data for deeper analysis.
- Build a dataset directly from your Sheet or Excel file
- Prepare and standardize your data by applying filters, changing data types, hiding, reordering, or renaming columns
- Merge datasets to analyze row-level data across multiple sources
- Calculate new columns to reflect your custom business logic
- Click on metrics created from your datasets to view the row-level data behind them
data integrations
New Dataset Integrations: Intercom and Snowflake
Now, you can use Intercom and Snowflake with datasets, giving you access to more properties and segments, and the ability to do deeper analysis.
With these dataset-supported integrations, you can:
- Create custom tables of raw data from Intercom or your Snowflake database
- Prepare your data by applying filters and customizing columns (change data types, hide, reorder, or rename them)
- Merge datasets to analyze the same row-level data across multiple sources
- Calculate new columns to create derived metrics that reflect your business logic
- Export your data to CSV to keep a historical record or continue your analysis elsewhere
- Click on the metrics created from your datasets to view the row-level data behind them
data integrations
New: MongoDB Integration

Connect MongoDB to Databox to make your backend data more accessible and actionable for your team.
- Build datasets: Select the specific collections you want to analyze, then clean and standardize your data for reporting.
- Create custom metrics: Apply dimensions and filters to save the exact version of the metric you need.
- Visualize and analyze performance: Use a variety of chart types to explore your data, break it down by dimension, compare performance across time periods, and drill down into the row-level details.
- Empower your team: Make your database data more accessible and actionable for your team.
improvement
Edit Performance Summaries to Include Insights That Numbers Alone Can’t Explain

Now, you can edit the text of AI-generated Performance Summaries on your Databoards and Reports.
Use the AI-generated summary as a starting point, then edit the text to add the context only you can provide, like what actions were taken, what you’ve been testing, or any open questions you’re still exploring.
Then, format the summary to make key points stand out. Use bold, italics, or highlights to emphasize important takeaways or add emojis to make your text more engaging and easier to scan.
Watch a quick tutorial to learn about this new improvement.
improvement
Manage Data Sources and User Permissions Across All Accounts – from One View

Now, you can view and manage all data sources and users across your agency and every client account—from one place. This makes it easier to save time and stay organized as your agency grows.
In the Account Management Application (AMA), head to the User Permissions or Data Manager pages to:
- See everything in one view – all users and data sources across every account
- Filter your view – by client account, connection status, role, and more
- Quickly take action – troubleshoot connection issues or review user access without switching accounts
improvement
Make Sure Your Databoards and Reports Are Always On-Brand

Now, you can save your visual settings as the default for new Databoards and Reports.
This means that every Databoard or Report you create will automatically use your preferred colors and logo, so everything stays consistent and polished, right from the start.
- Create a consistent visual style across all your Databoards and Reports
- Save time by overriding existing Databoard and account templates across your account and client accounts
- Quickly apply your default settings to all client Databoards and Reports to match your brand– or theirs!