Product updates
new
Give your AI Analyst the context to explain performance and help you take action
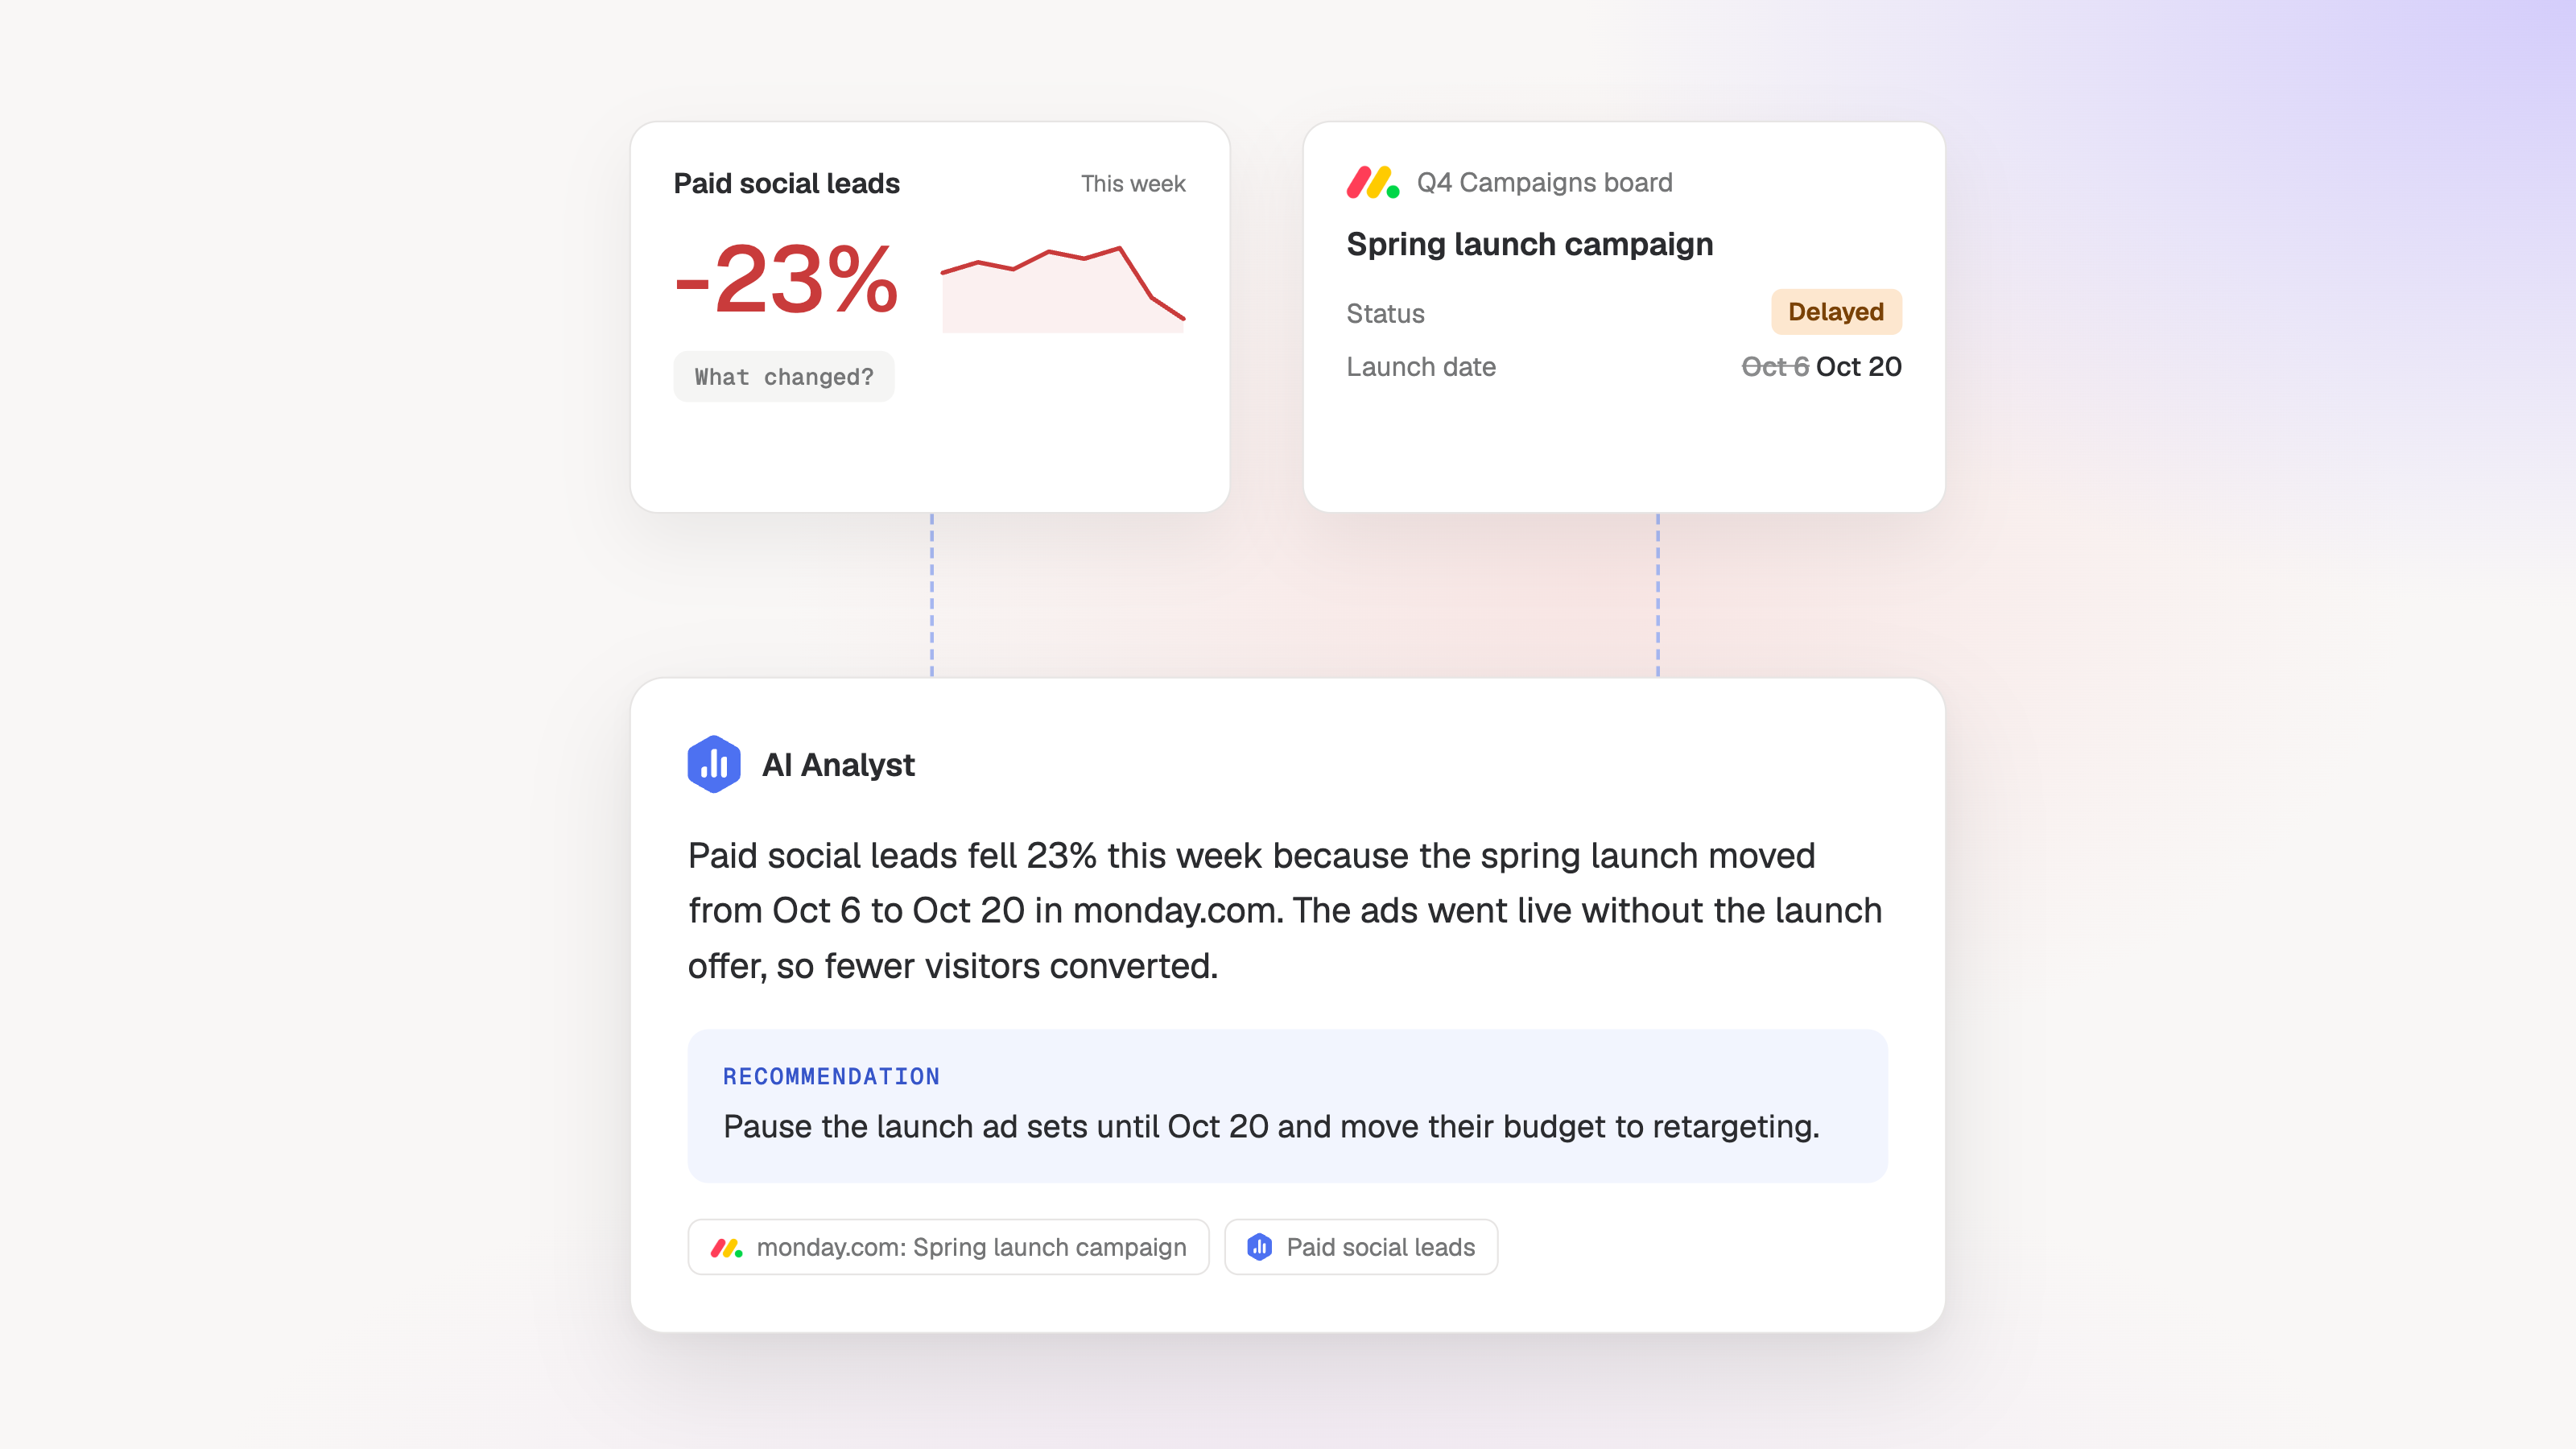
Now, you can connect your business tools to your AI Analyst so it can better understand what's happening in your business, deliver more relevant recommendations, and help you act on them.
- 50+ pre-built AI connectors: Connect tools like HubSpot, Asana, and Amplitude in one click from the AI connectors library.
- Custom AI connectors: Add any tool that has an MCP server by entering its URL and signing in with the authentication method the server supports.
- Analysis with business context: Your AI Analyst checks your connected tools when it looks into a change, so its explanation reflects the reality of your business.
- Action in connected tools: Ask your AI Analyst to create a follow-up task or update a record in the connected tool right from the chat.
- Permissions you control: Set each tool, or a whole group of tools, to always allow, needs approval, or blocked.
new
Get recurring analysis delivered on schedule
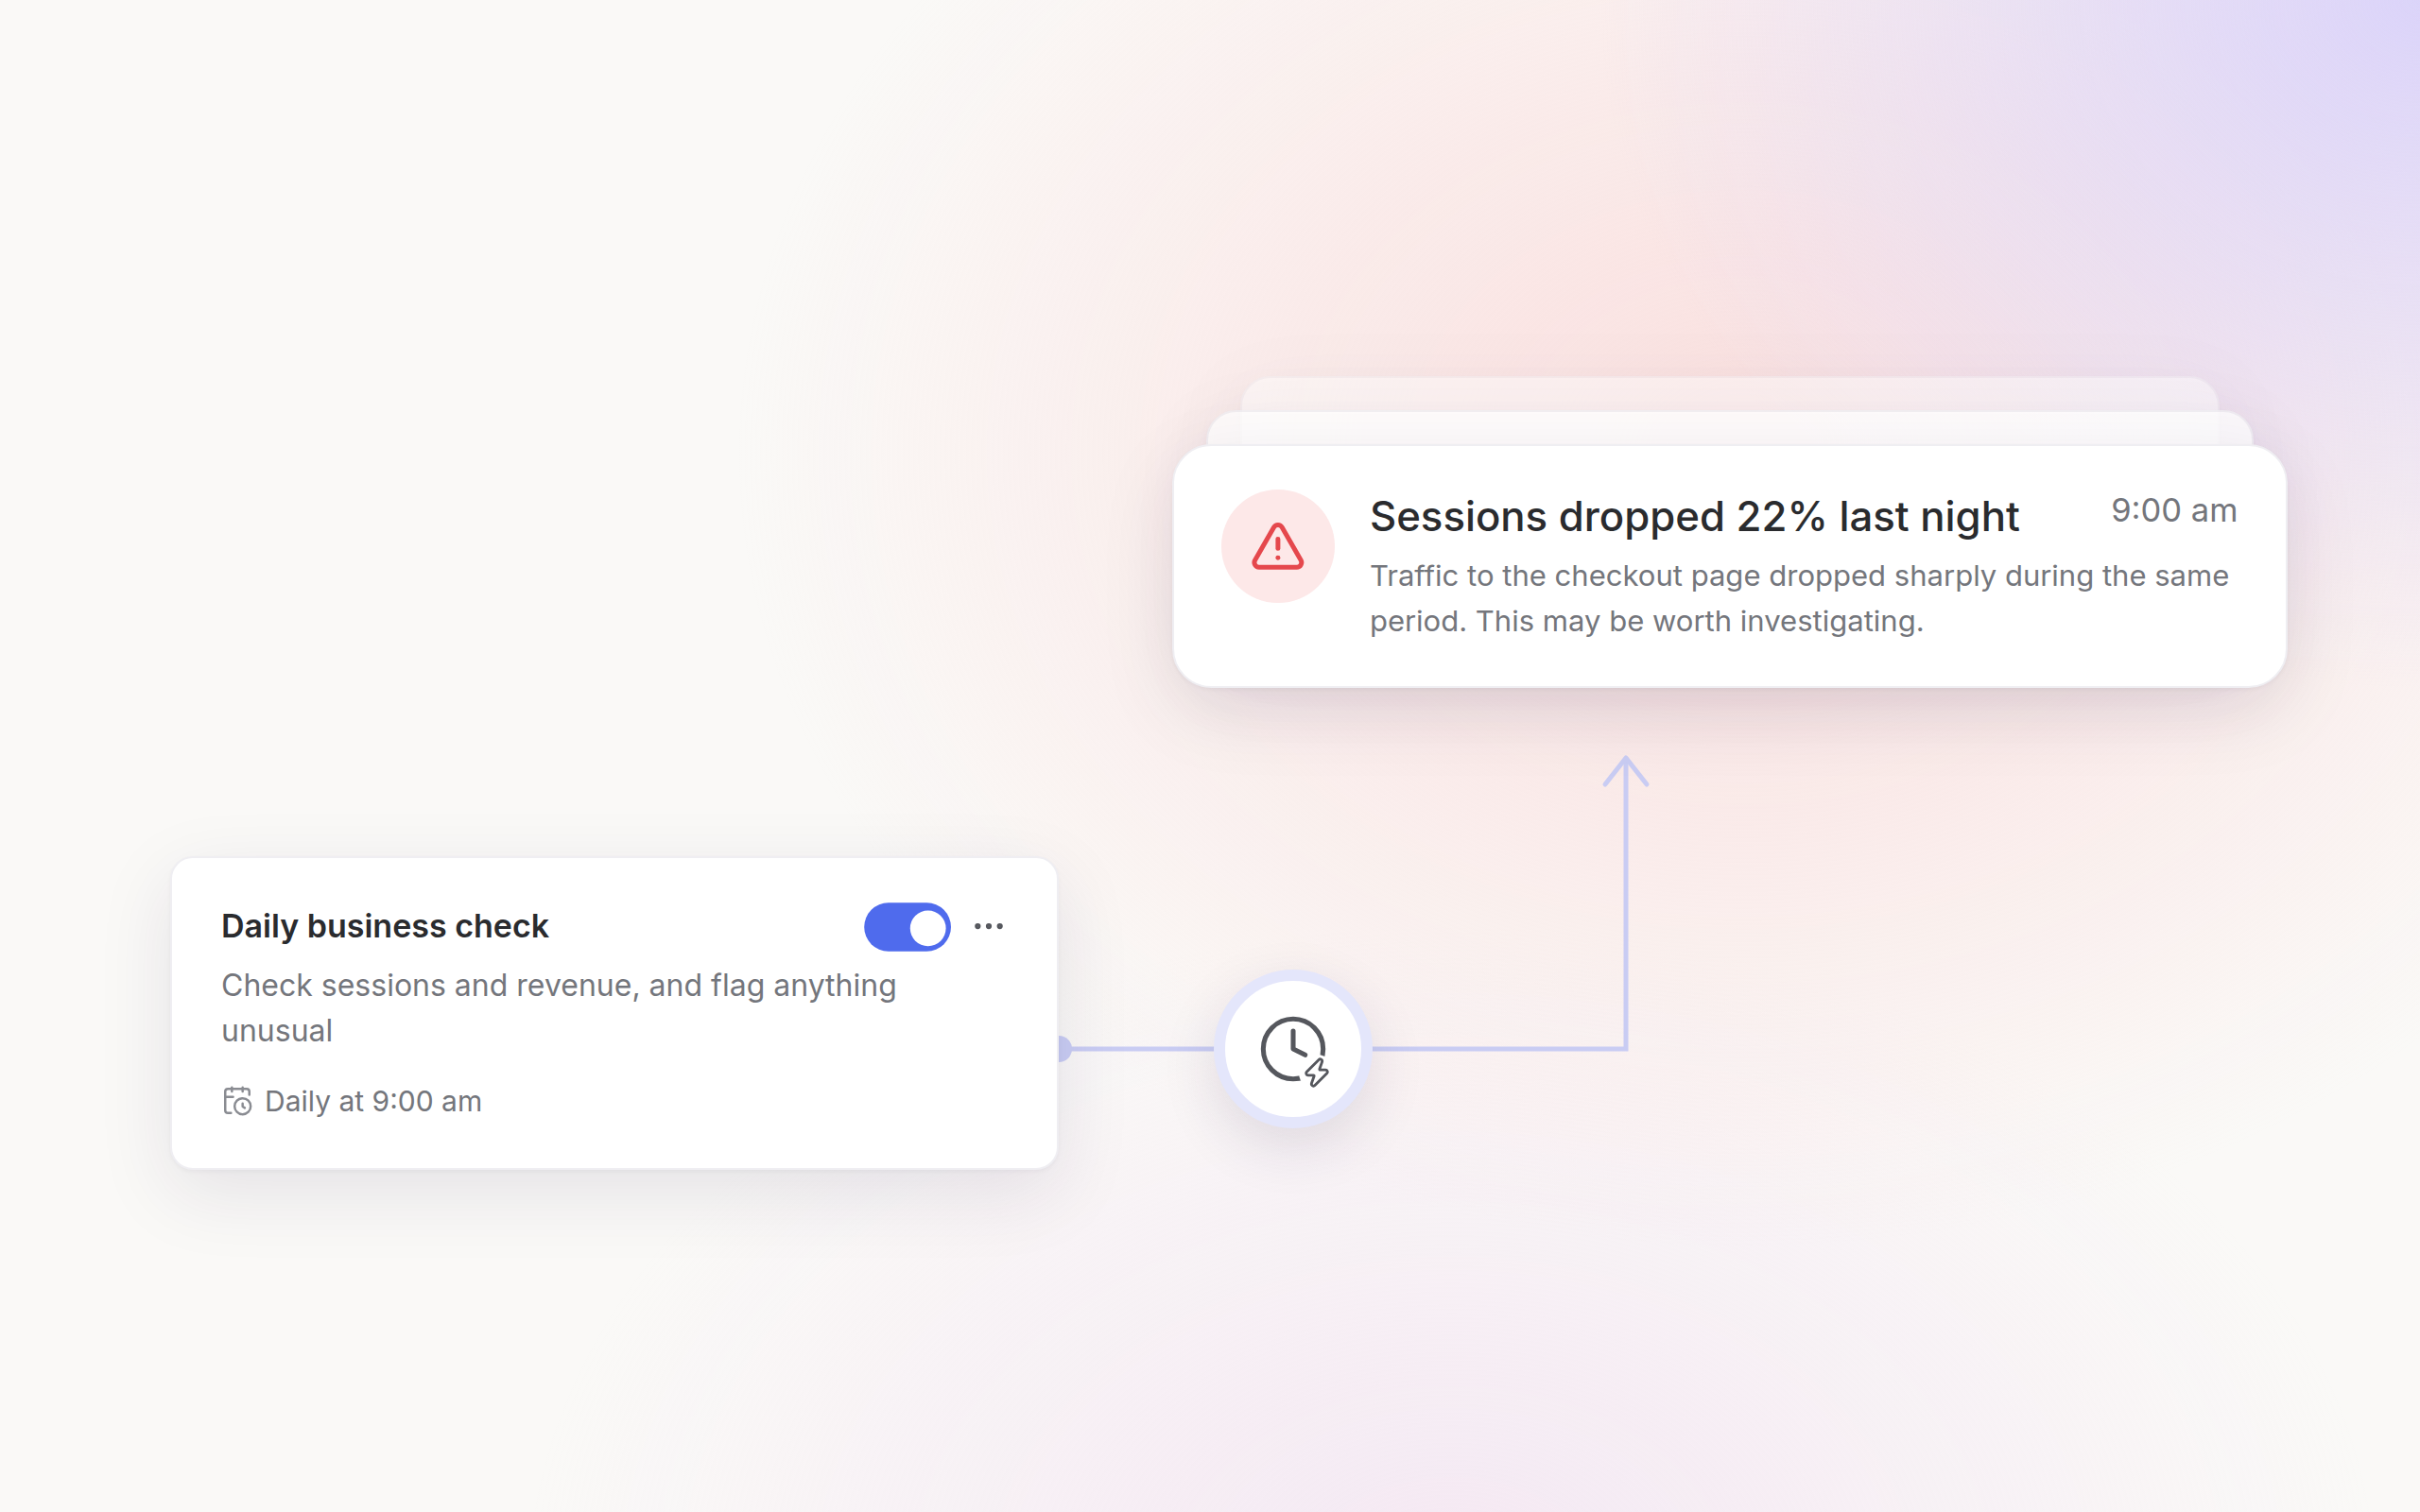
Give your AI Analyst a prompt and a cadence, and it runs the analysis using your live data and business context, then delivers the findings or finished report by email, Slack, or in-app.
- Create it from a form or a conversation: Create a Routine by filling in the name, prompt, and schedule manually. Or ask your AI Analyst in chat to turn a prompt into a Routine.
- Run on a schedule or a trigger: Choose a daily, weekly, or monthly cadence, or start a Routine from a webhook when something happens in another system.
- Follow up on any run: Every run is saved under its Routine, so you can open a past report and ask a follow-up question that continues from those results.
Want to learn more about Routines? Read the blog.
improvement
Personalize your home screen around how you work
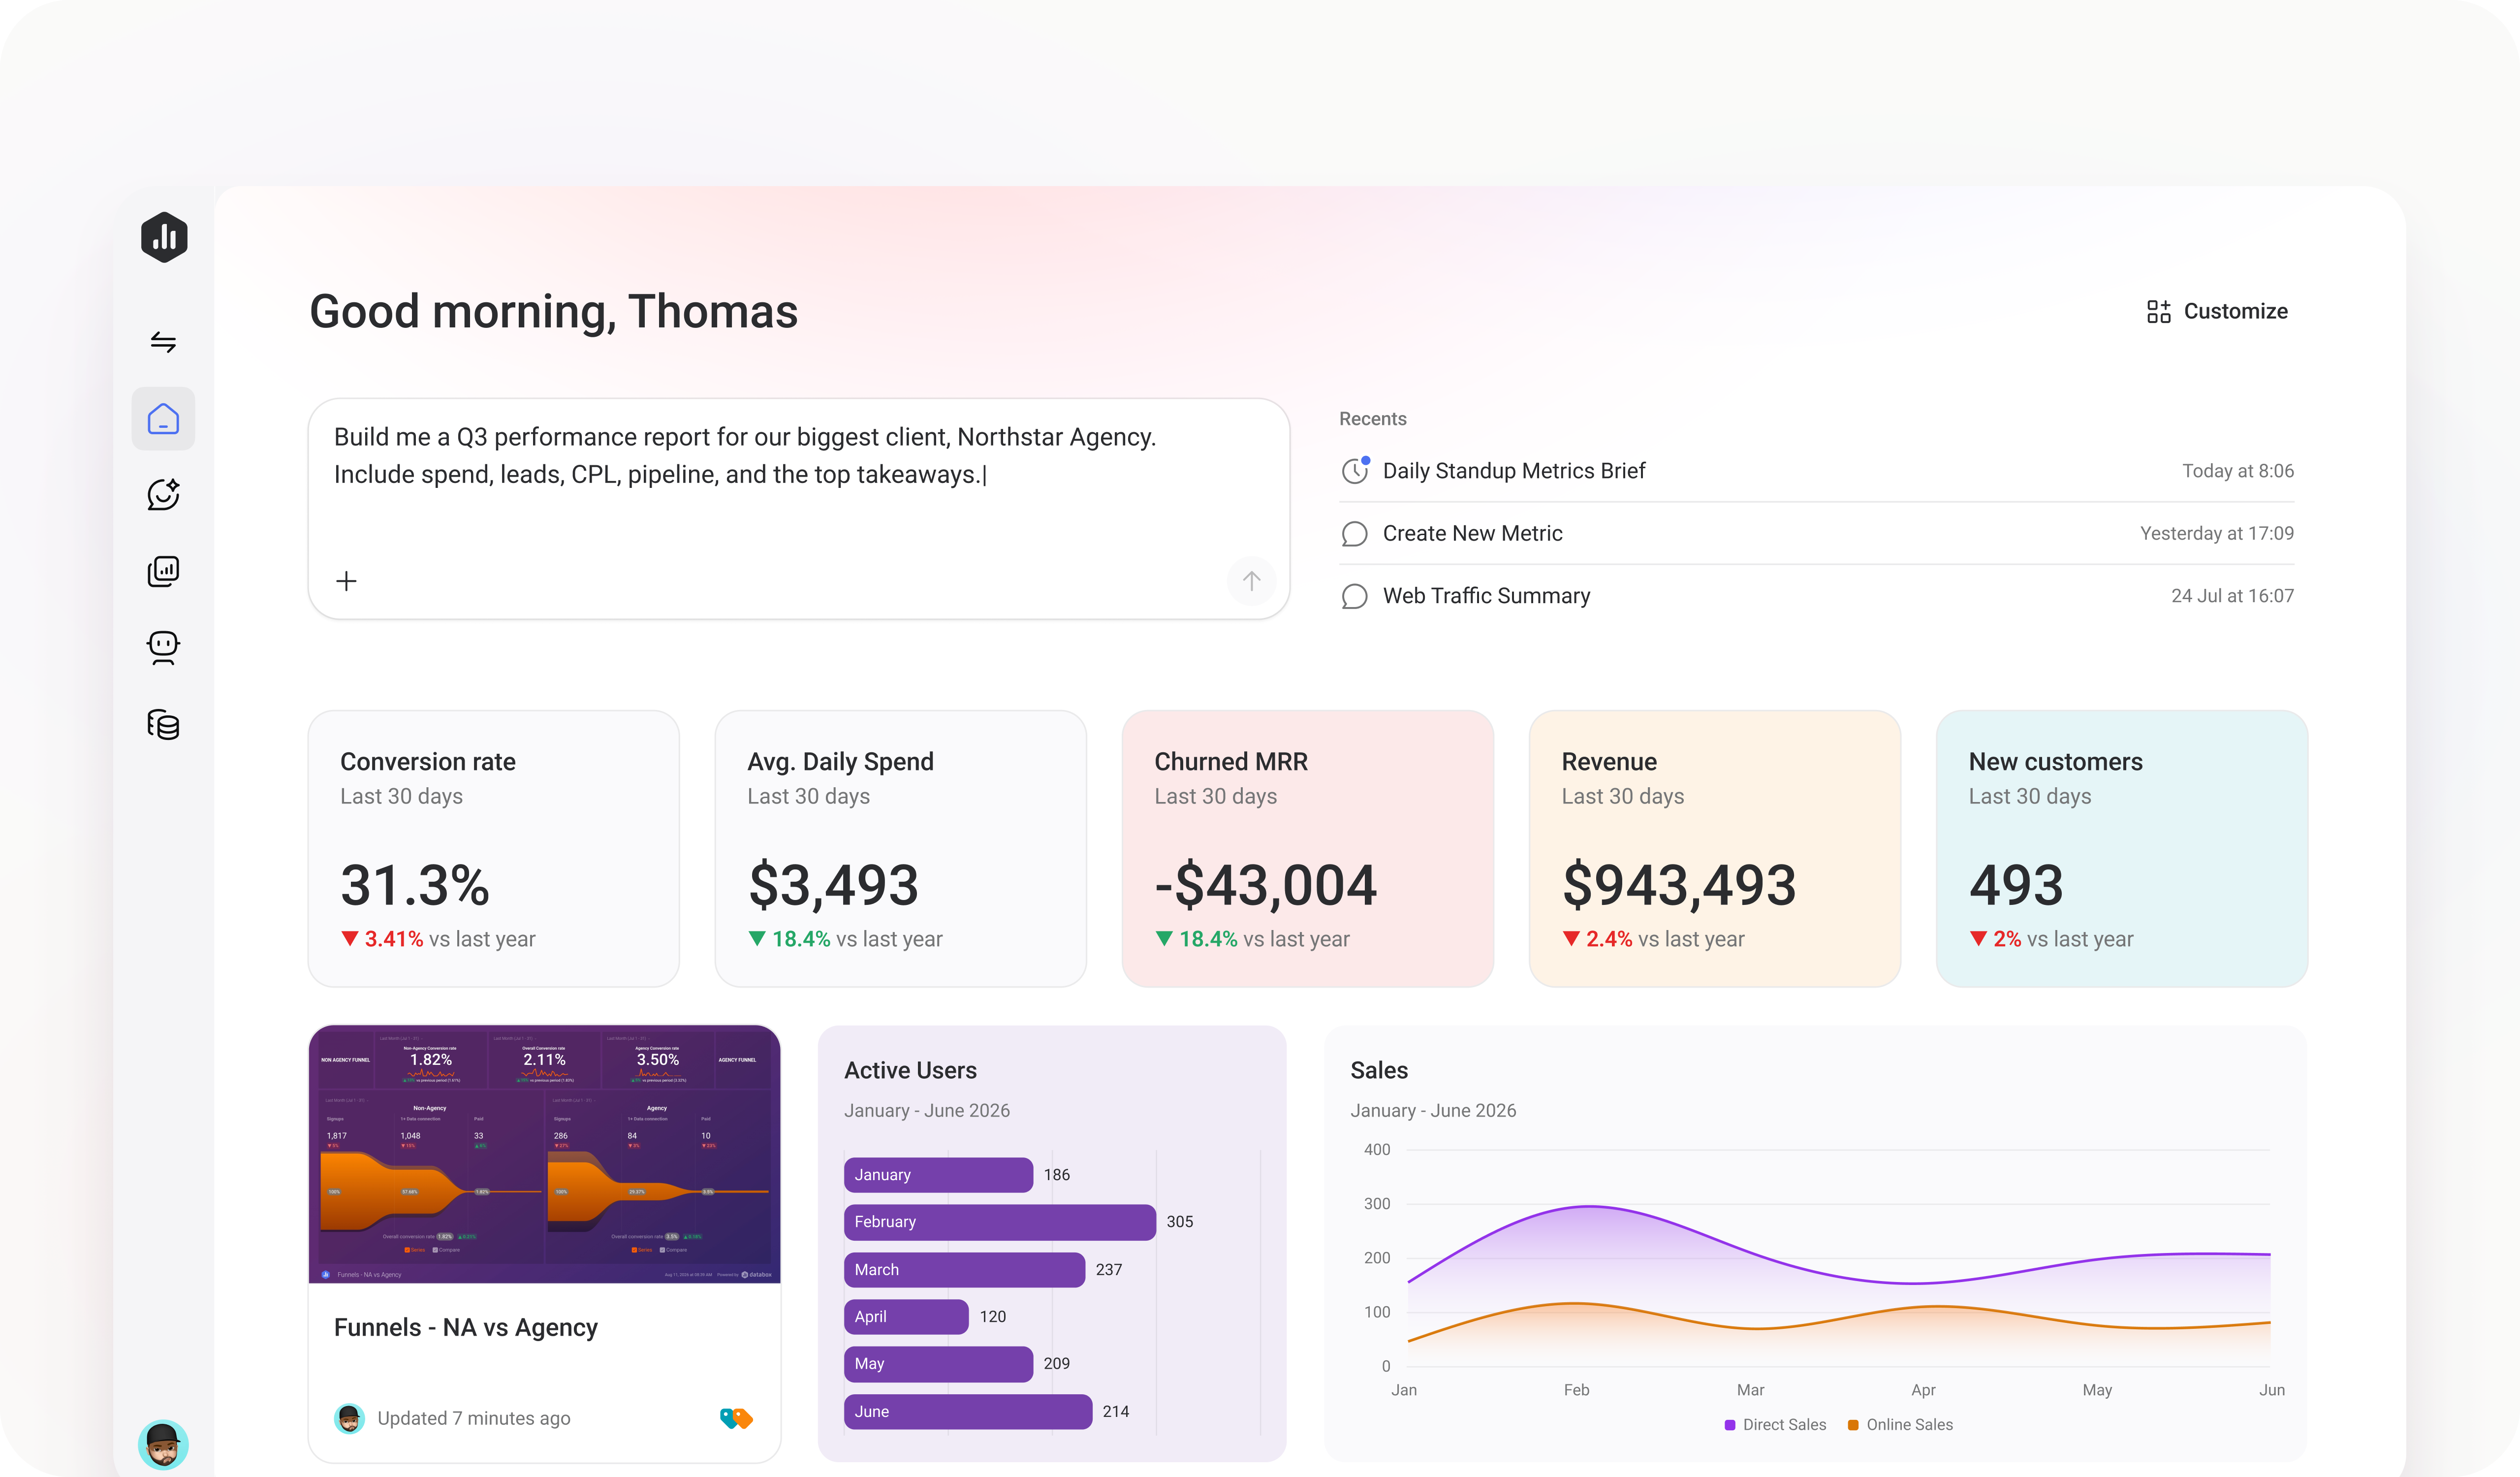
Choose what you see when you log in and organize your home screen around the metrics, reports, and analysis that matter most to you.
- Keep what matters in view: Add the metrics, Databoards, reports, Artifacts, and notes you use most, and remove what you do not need.
- Organize it your way: Reorder widgets, group related information into sections, and use color to make important metrics easier to spot.
- Keep AI Analyst close by: Start a new conversation, return to recent ones, or use suggested prompts from your home screen.
new
Turn your reporting and analysis process into a reusable Skill
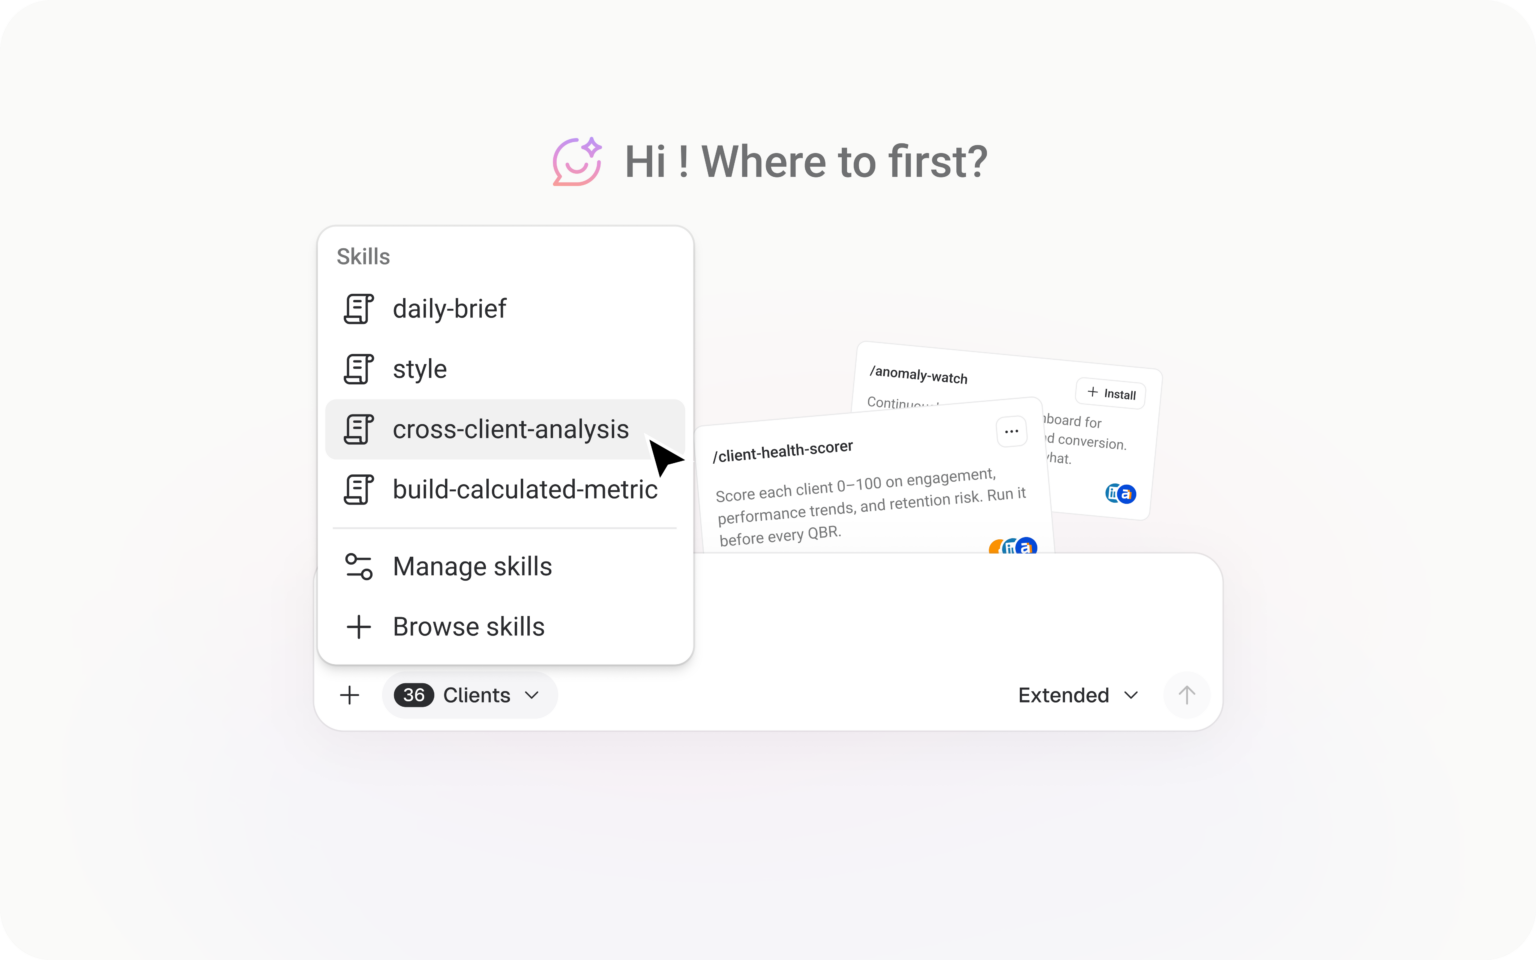
Now you can save the steps, standards, and context behind a task as a Skill, so your AI Analyst follows the same process every time the work comes up.
- Create a Skill from an existing process or a conversation: Write the instructions yourself, upload a file you already use, or describe the process to your AI Analyst in chat. Your AI Analyst asks follow-up questions and drafts the Skill for you to review.
- Start recurring work with the right process in place: Run a Skill directly with a slash command, or ask your AI Analyst as you normally would. When your request matches an enabled Skill, your AI Analyst applies it automatically.
- Give everyone a consistent way to work: Keep a Skill personal when it reflects how you work, or share it with the company so everyone in your account follows the same steps and standards.
improvement
Get answers tailored to your goals and focus metrics
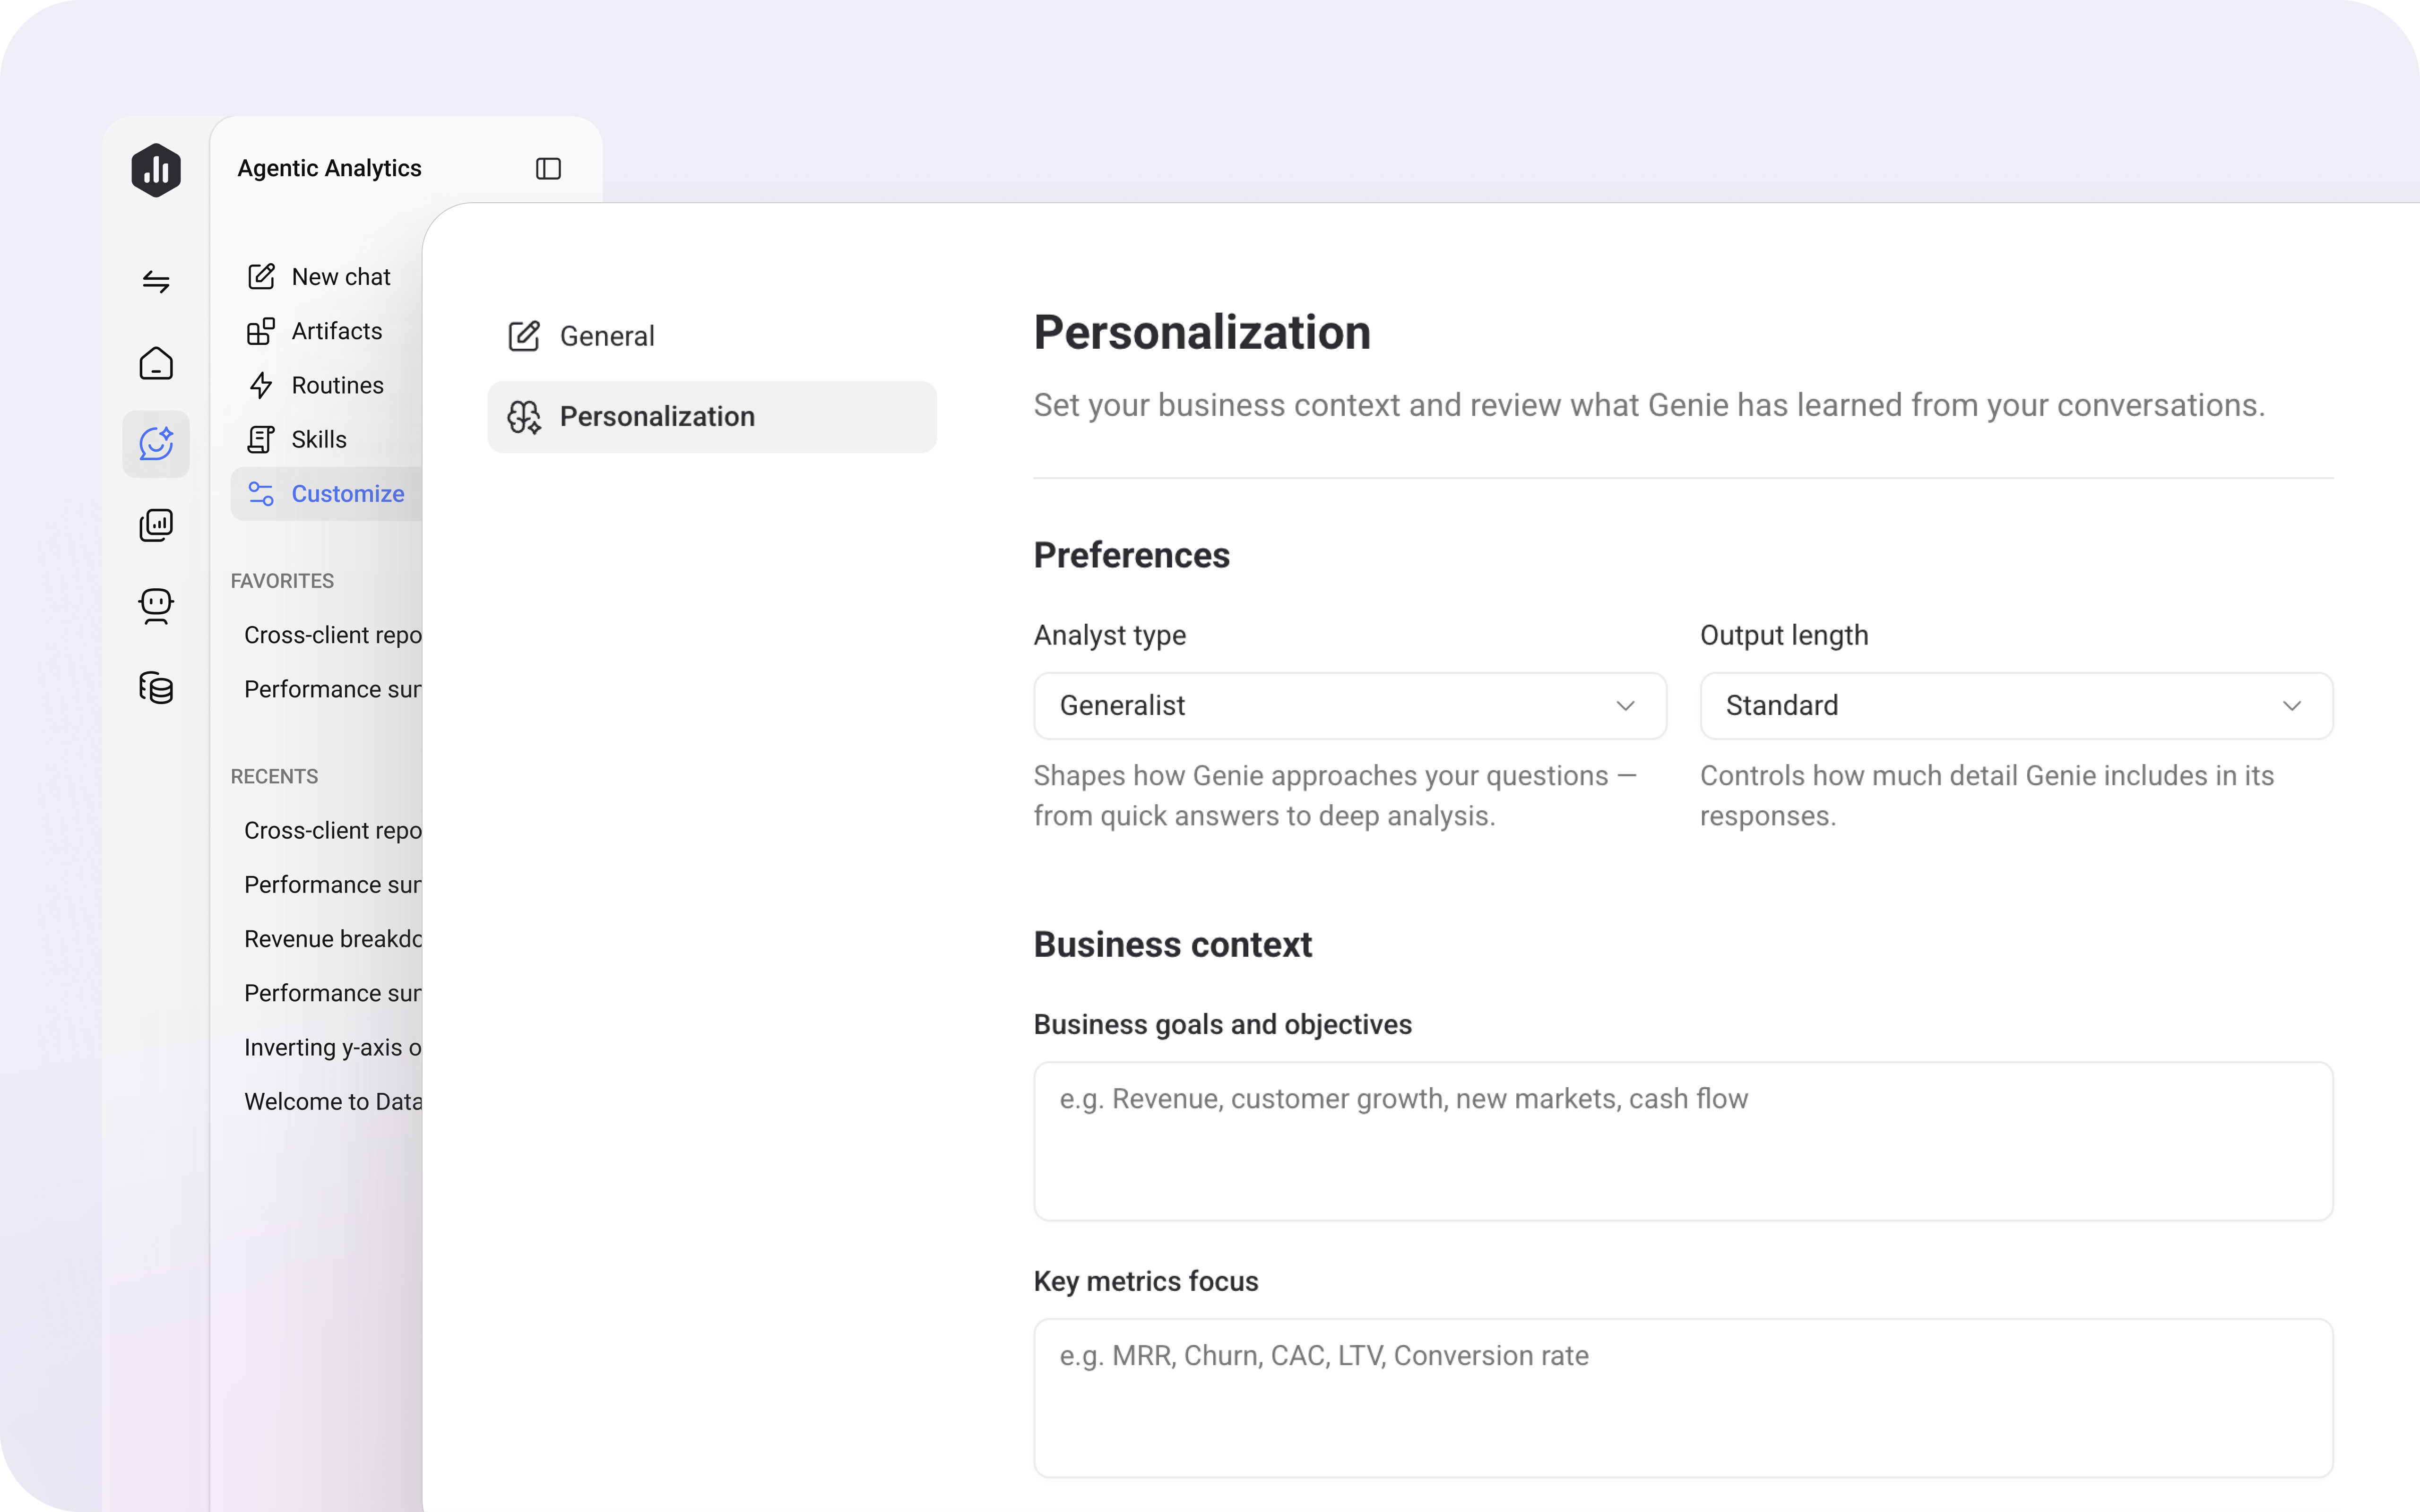
Now, you can give your AI Analyst your business context, and it factors your industry, goals, and focus metrics into every answer it will provide.
- Set your context: Define your industry, goals, and the metrics you're accountable for, and your AI Analyst scopes every answer to what you report against.
- Let your AI Analyst learn from you: It picks up facts about your business from your conversations and applies them to later ones, so the context you gave in March still holds in September.
- Get answers in the format you want: Pick the desired style and length of answers, and your AI Analyst sticks to it without you restating it.
improvement
Find the artifacts you previously created
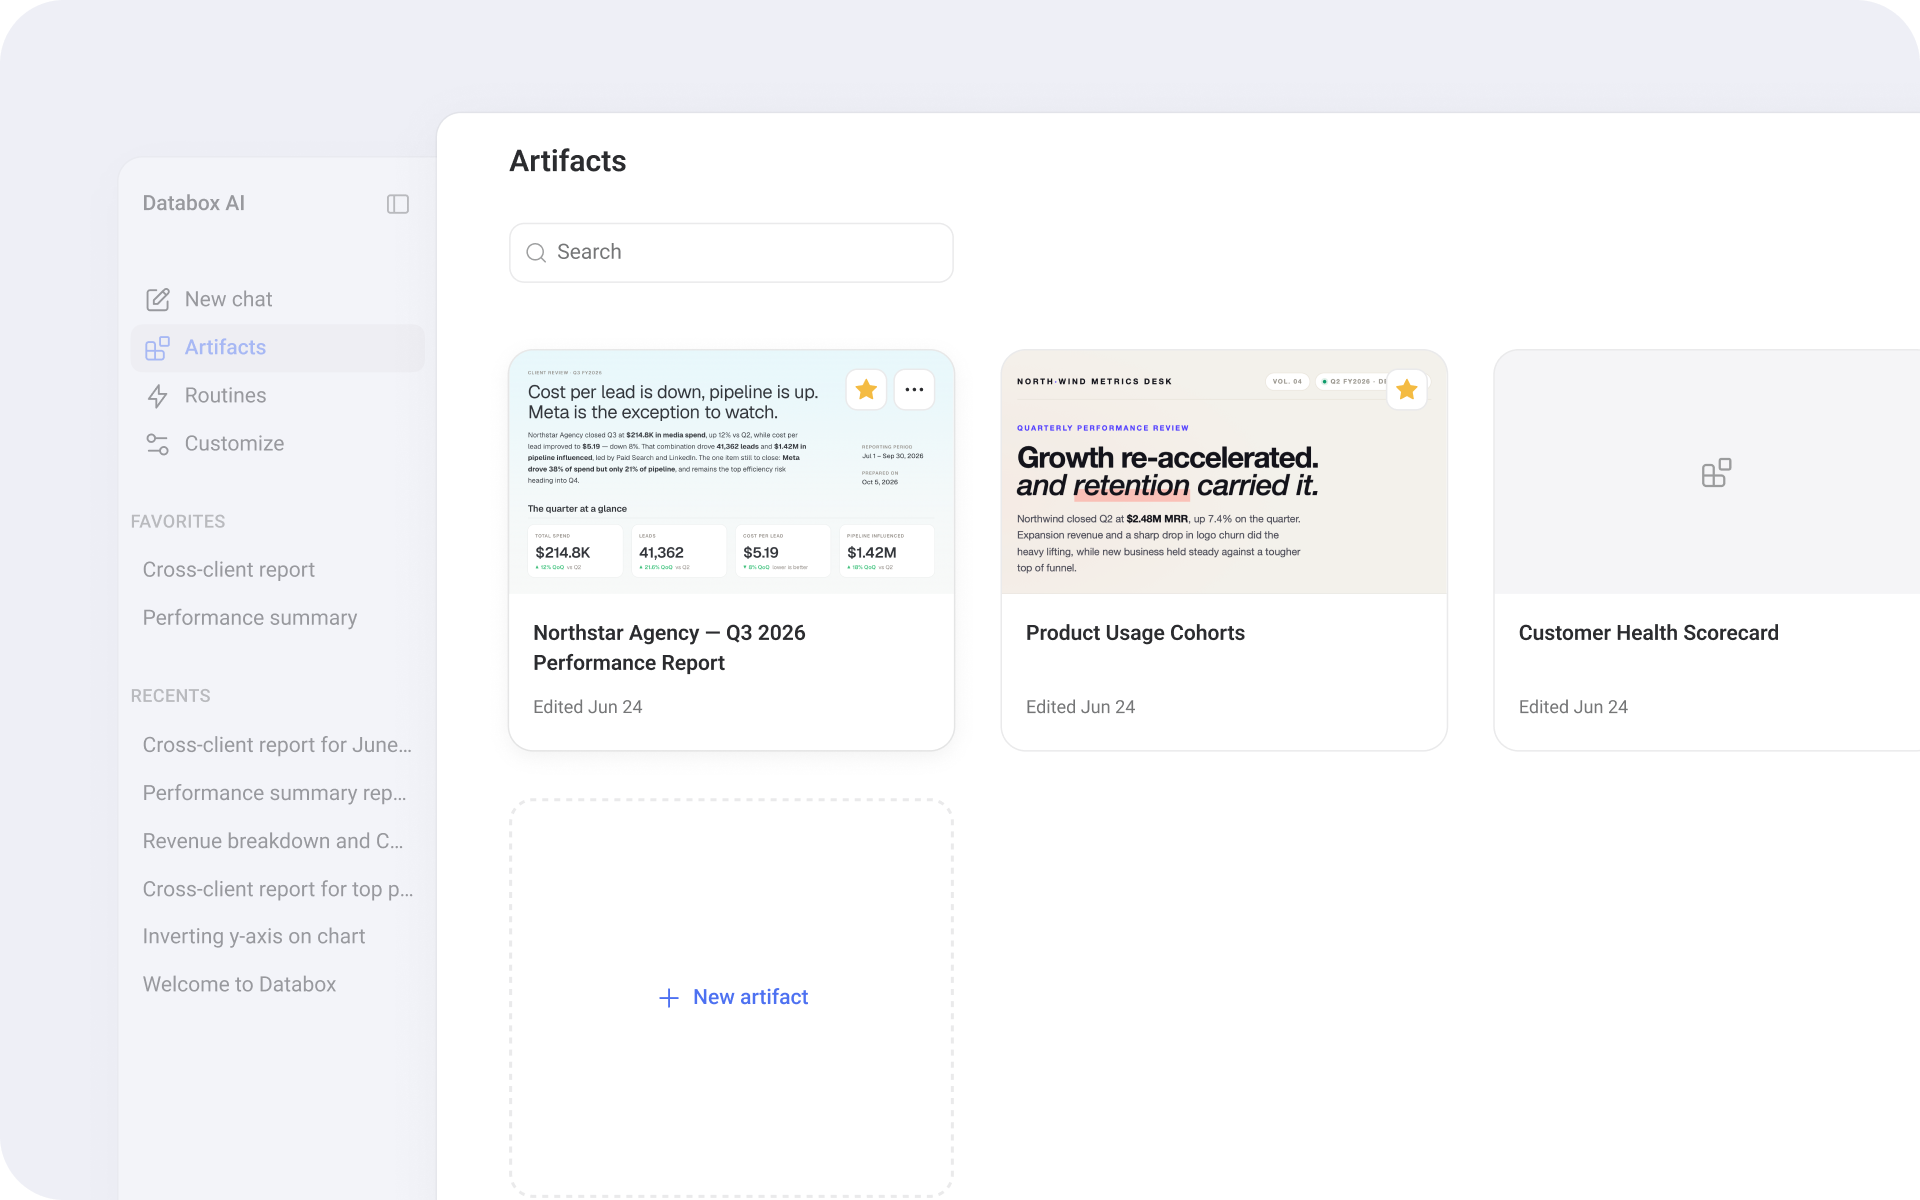
Now, every artifact you create is saved in Databox automatically. Search by name, star your favorites, and reopen any artifact without scrolling through old conversations.
This means the report you built last month is only a search away, ready to reshare or update whenever someone asks for it again.
improvement
Edit any artifact directly
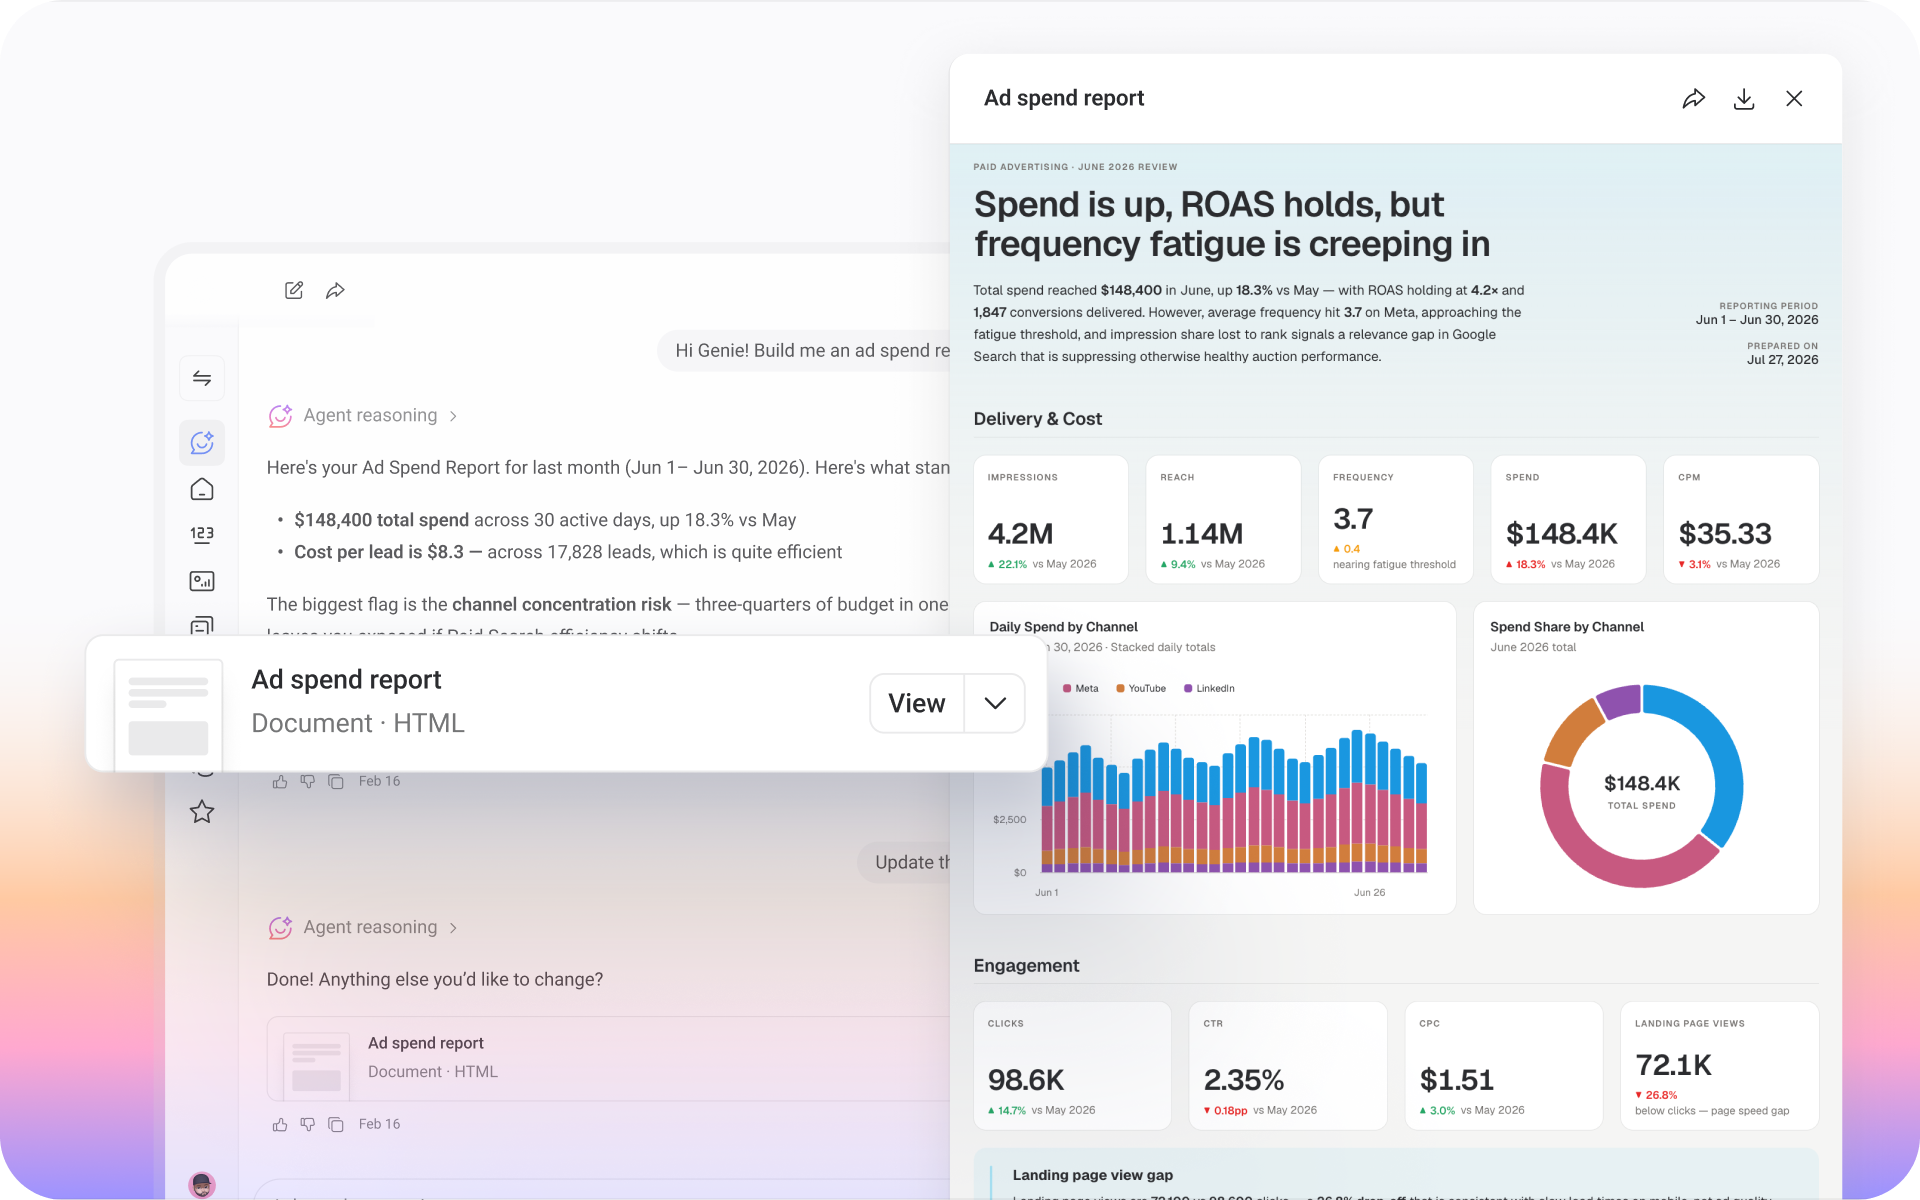
You can now click into any artifact and edit the text directly. Tweak a headline or bold what's important, so the final touches before you share take seconds instead of another round of prompting.
improvement
Define what your data actually means
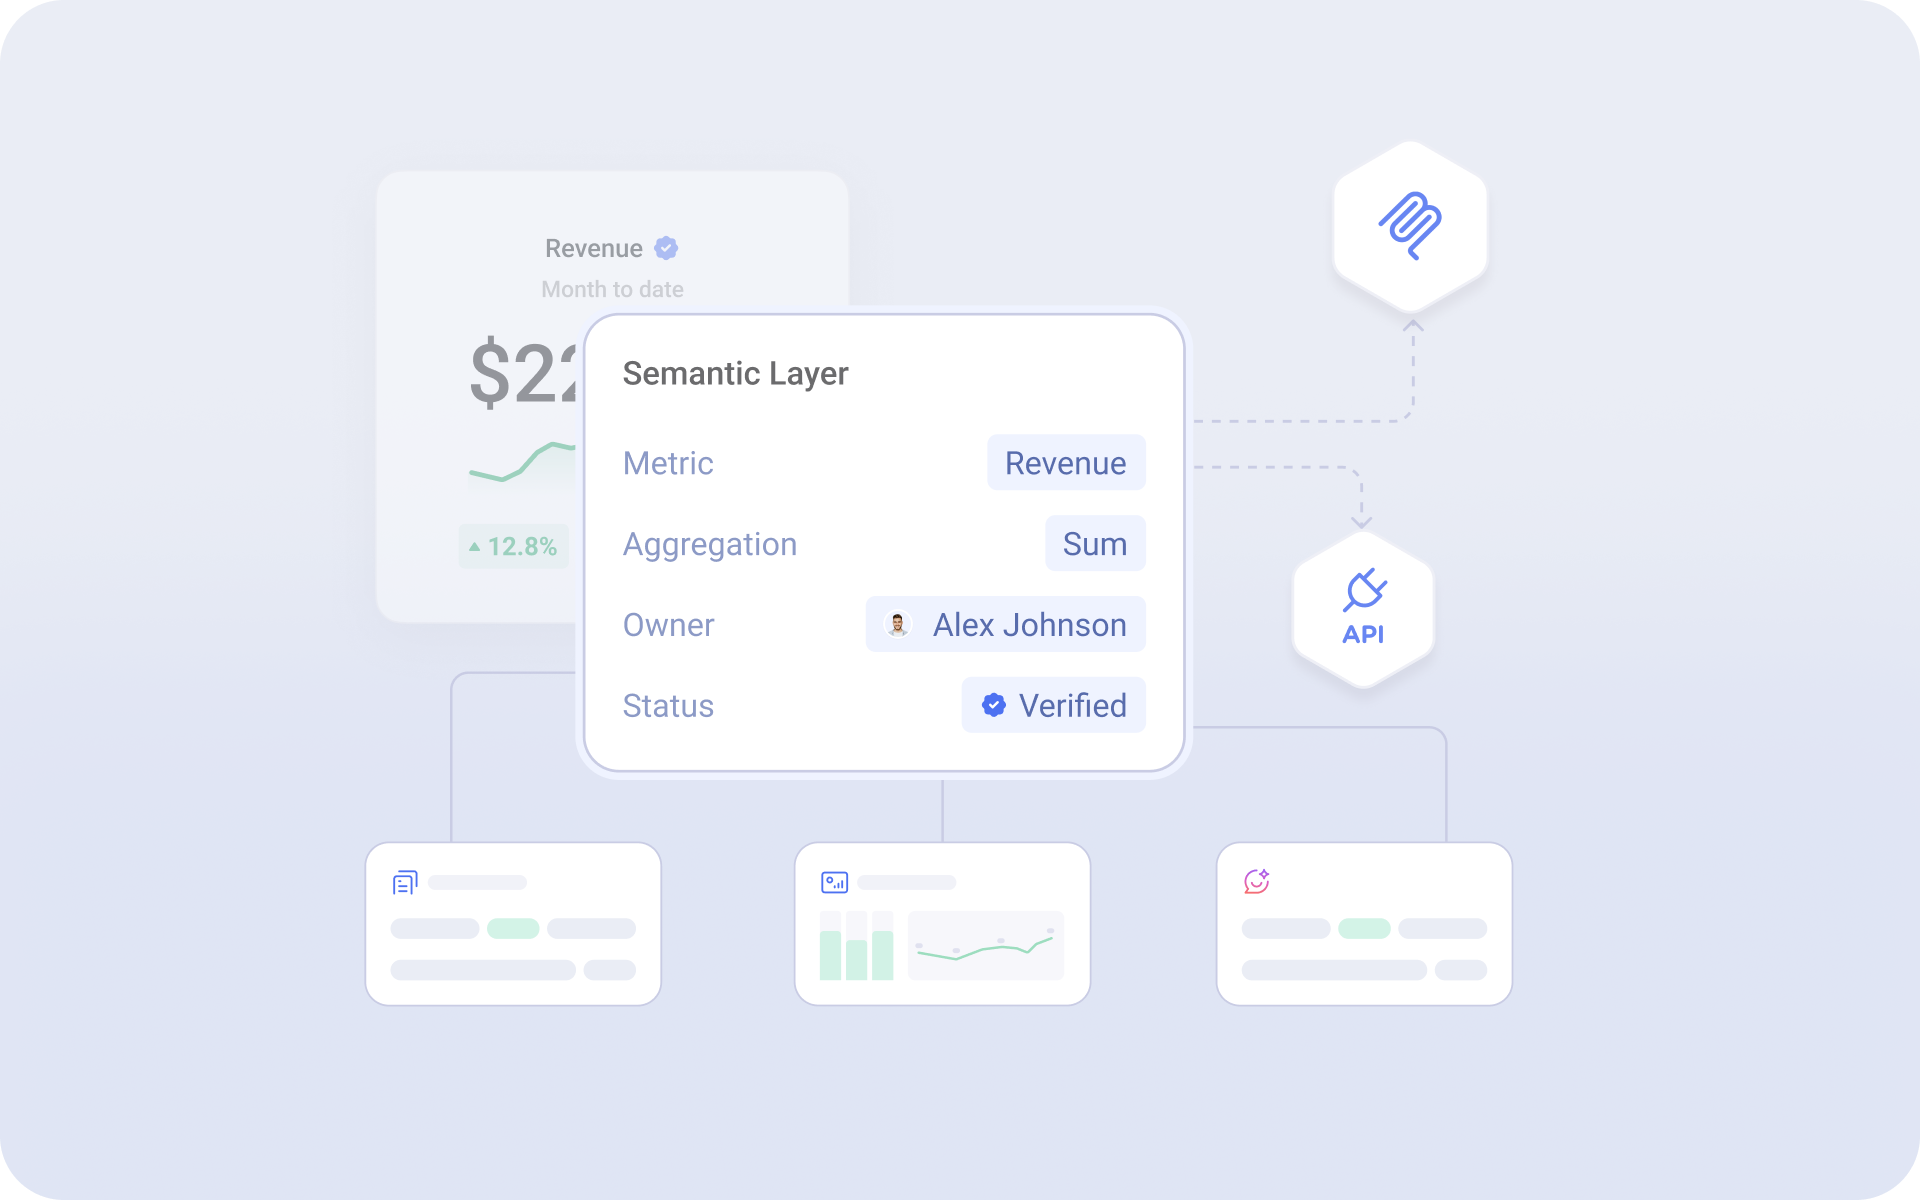
Now you can define what each dataset and column means, so your team and AI Analyst read every number the same way.
- Understand any dataset without asking the analyst. Document what each dataset and column means in plain language, so anyone can read it on their own.
- Get the right answer no matter how it's phrased. Capture the other names your team uses for a dataset or column, so your AI Analyst answers the real question even when someone words it differently.
- Keep every query on the right dates. Set a default time dimension for each dataset, so queries and AI answers always pull from the correct date column.
new
Get every team and AI working from the same numbers
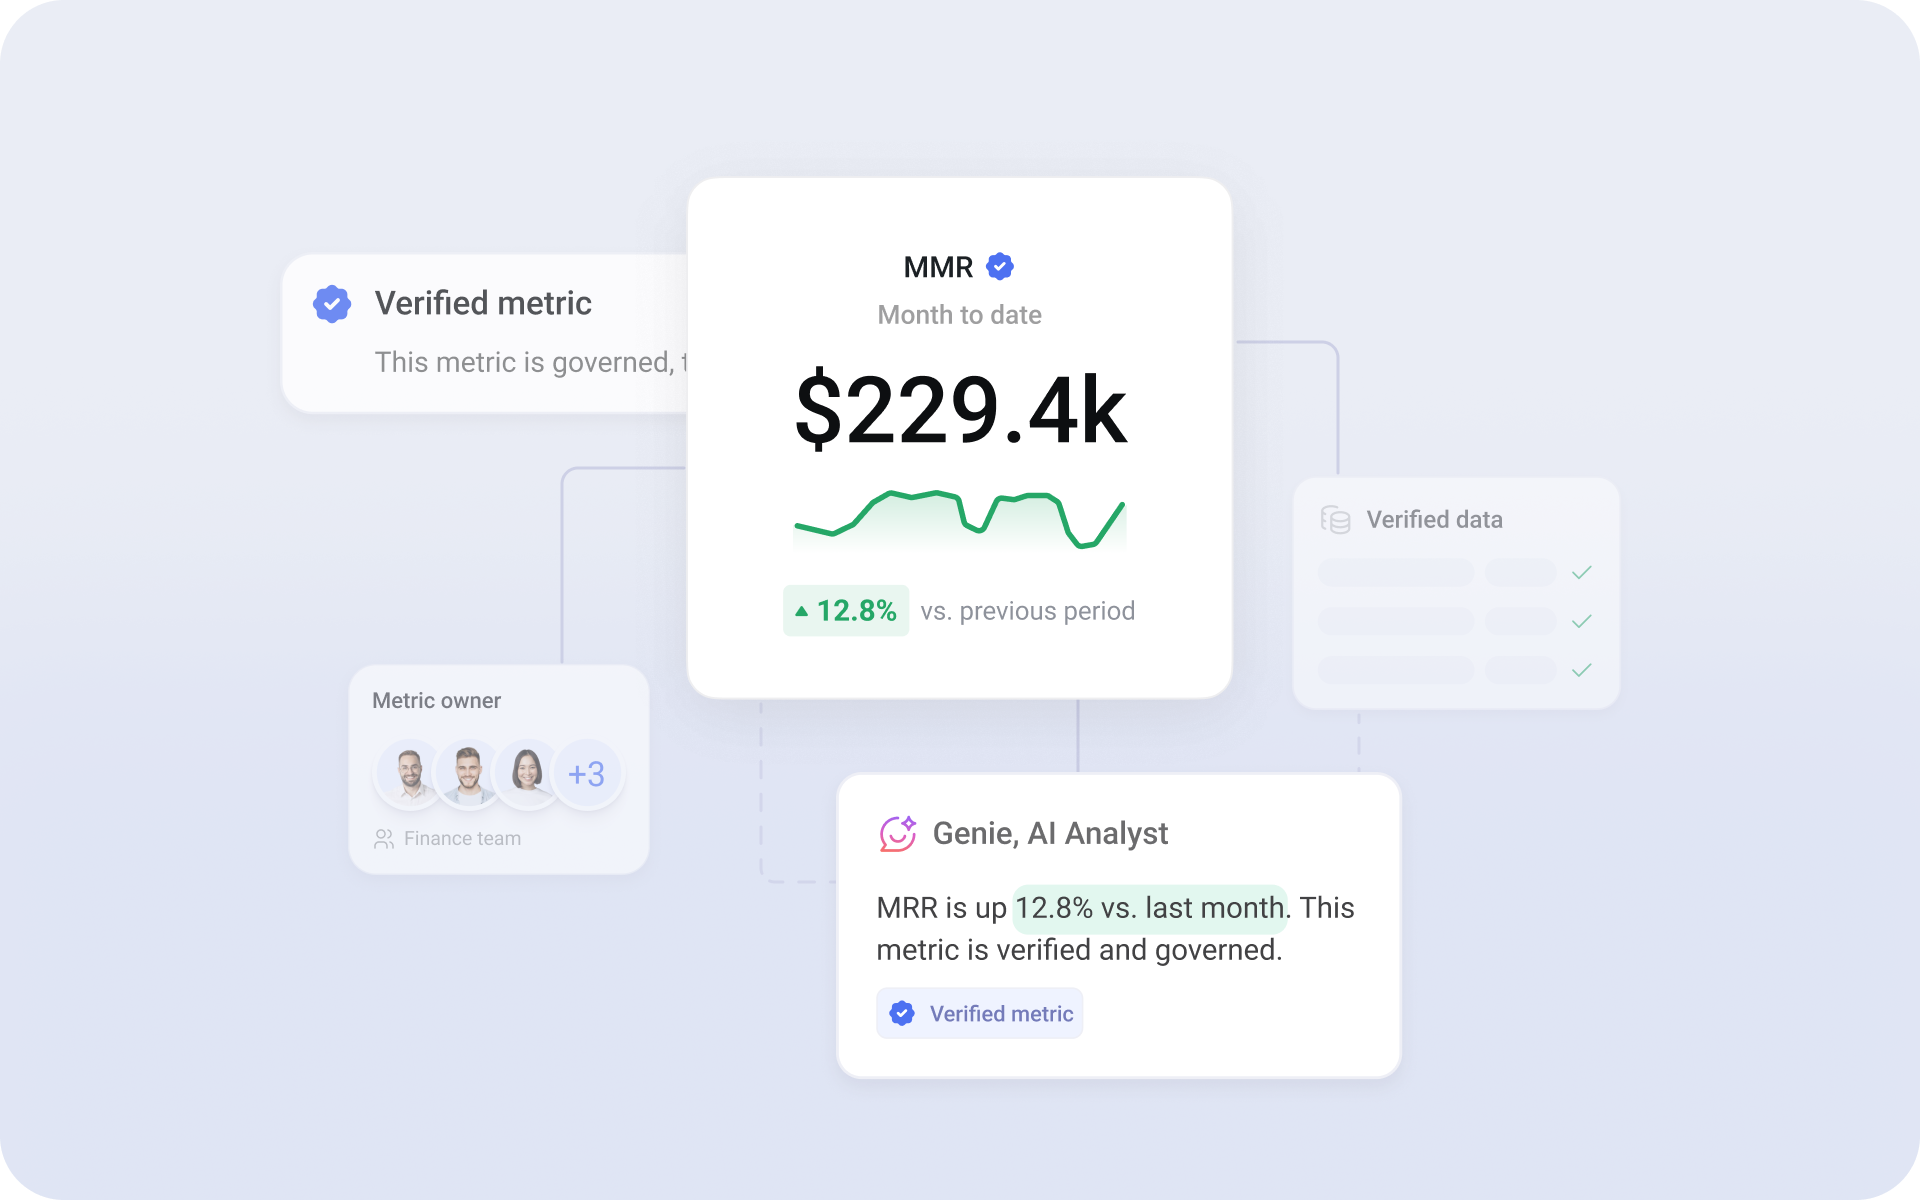
Now you can verify metrics, datasets, dashboards, and reports, so everyone on your team, including Genie, knows which version is official.
- Verified badge on every official asset: Anyone with edit rights can verify a metric, dataset, Databoard, or report, and a verified badge appears next to its name so the trusted version stands out wherever it shows up.
- Recorded verification history: Every verification logs who verified the asset and when, so you have an audit trail when leadership asks where a number came from.
- AI answers grounded in verified assets: The AI Analyst reads verification status as a trust signal, so its answers come from the same official version your team already relies on.
improvement
Turn your analysis into a polished, shareable report
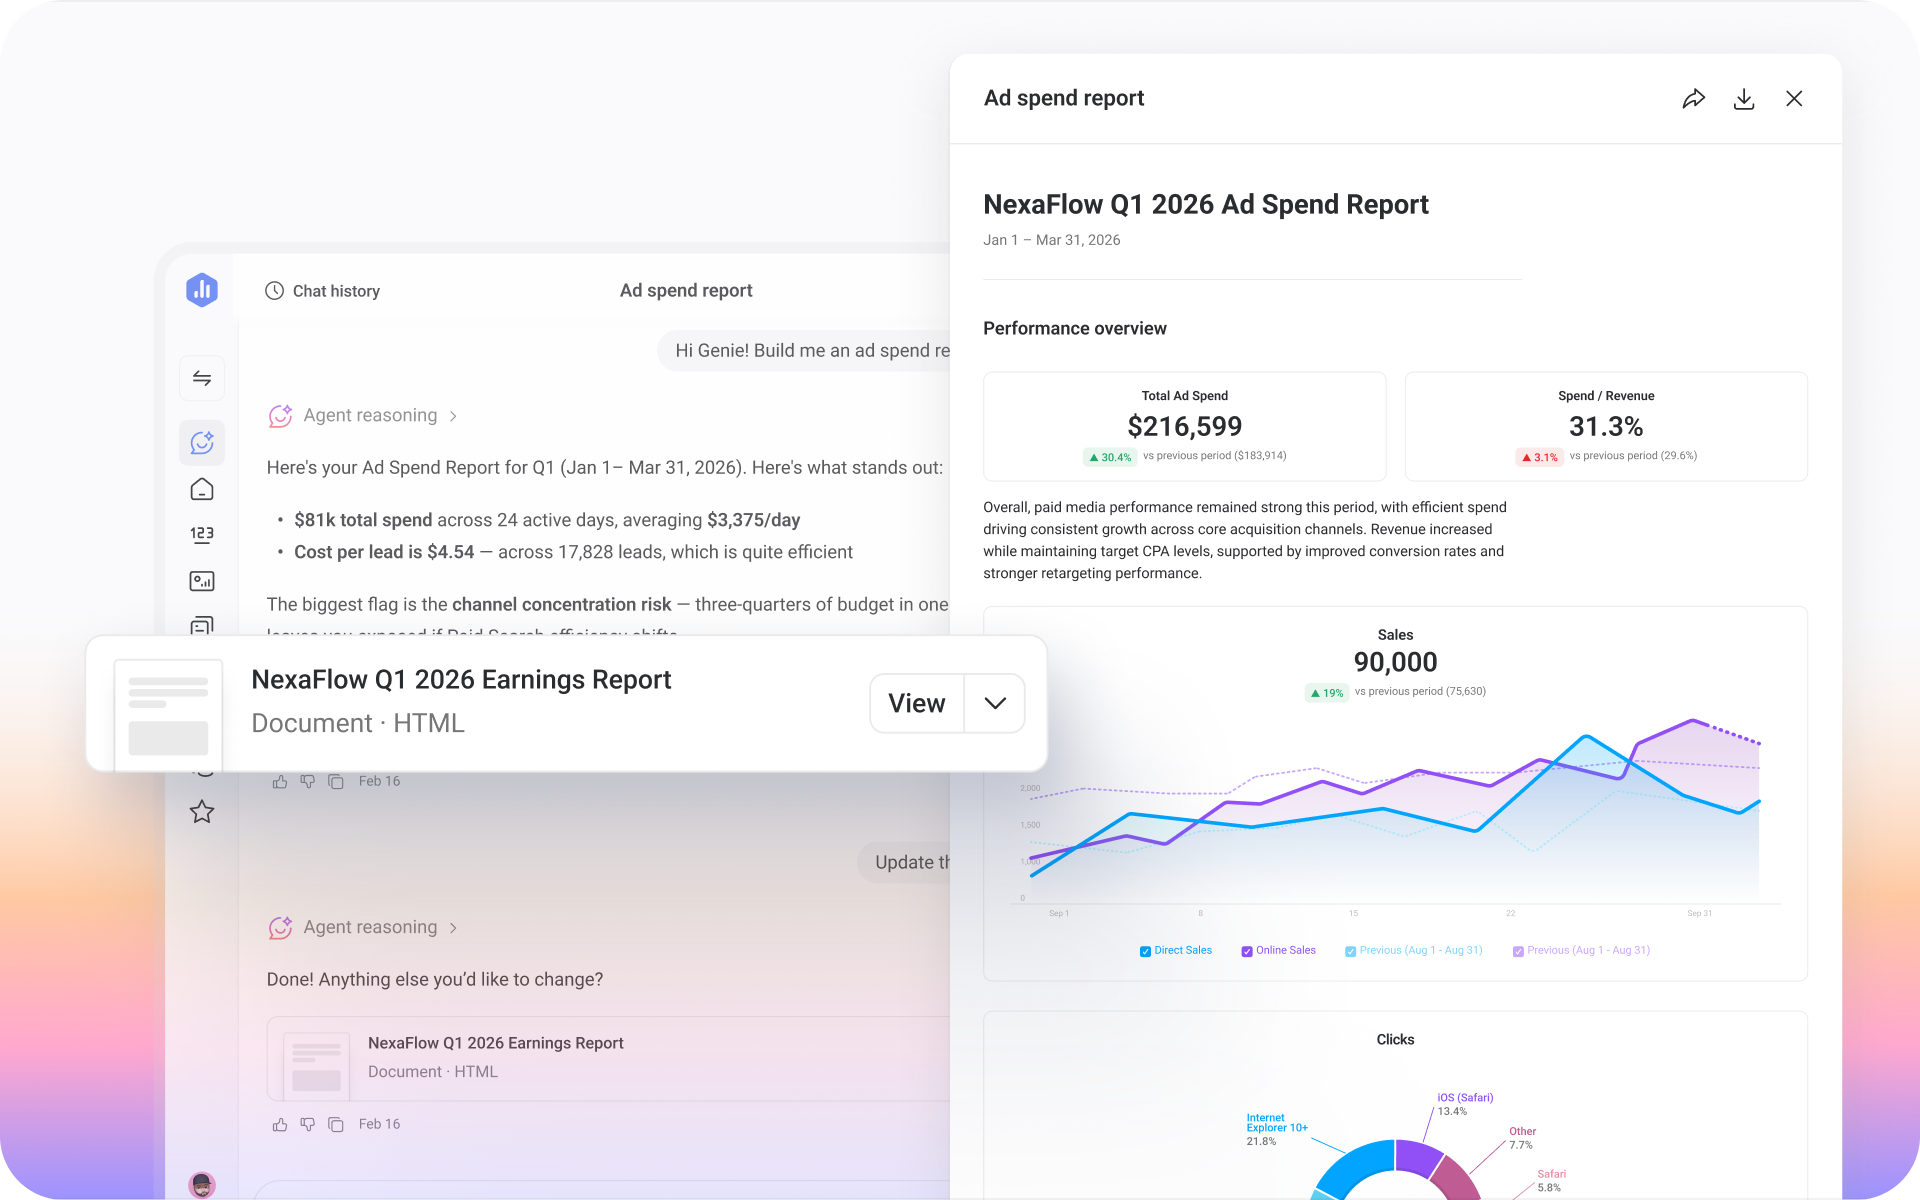
Now, you can package any Genie conversation into an Artifact: a polished, interactive document built from your connected data that you can send to anyone.
- Generate a full report from your conversation: Ask Genie to turn its analysis into a report, and you'll get back a finished, interactive document.
- Share with anyone: Send the Artifact through a public link or download it as a PDF. No Databox login required.
- Switch formats anytime: Ask Genie to convert the report into a slide deck, dashboard, or another format, and it rebuilds the Artifact for you.
- Customize the styling: Ask Genie to restyle the Artifact with your colors, fonts, or layout, and it rebuilds the Artifact to match.
improvement
Get richer answers in your next Claude conversation
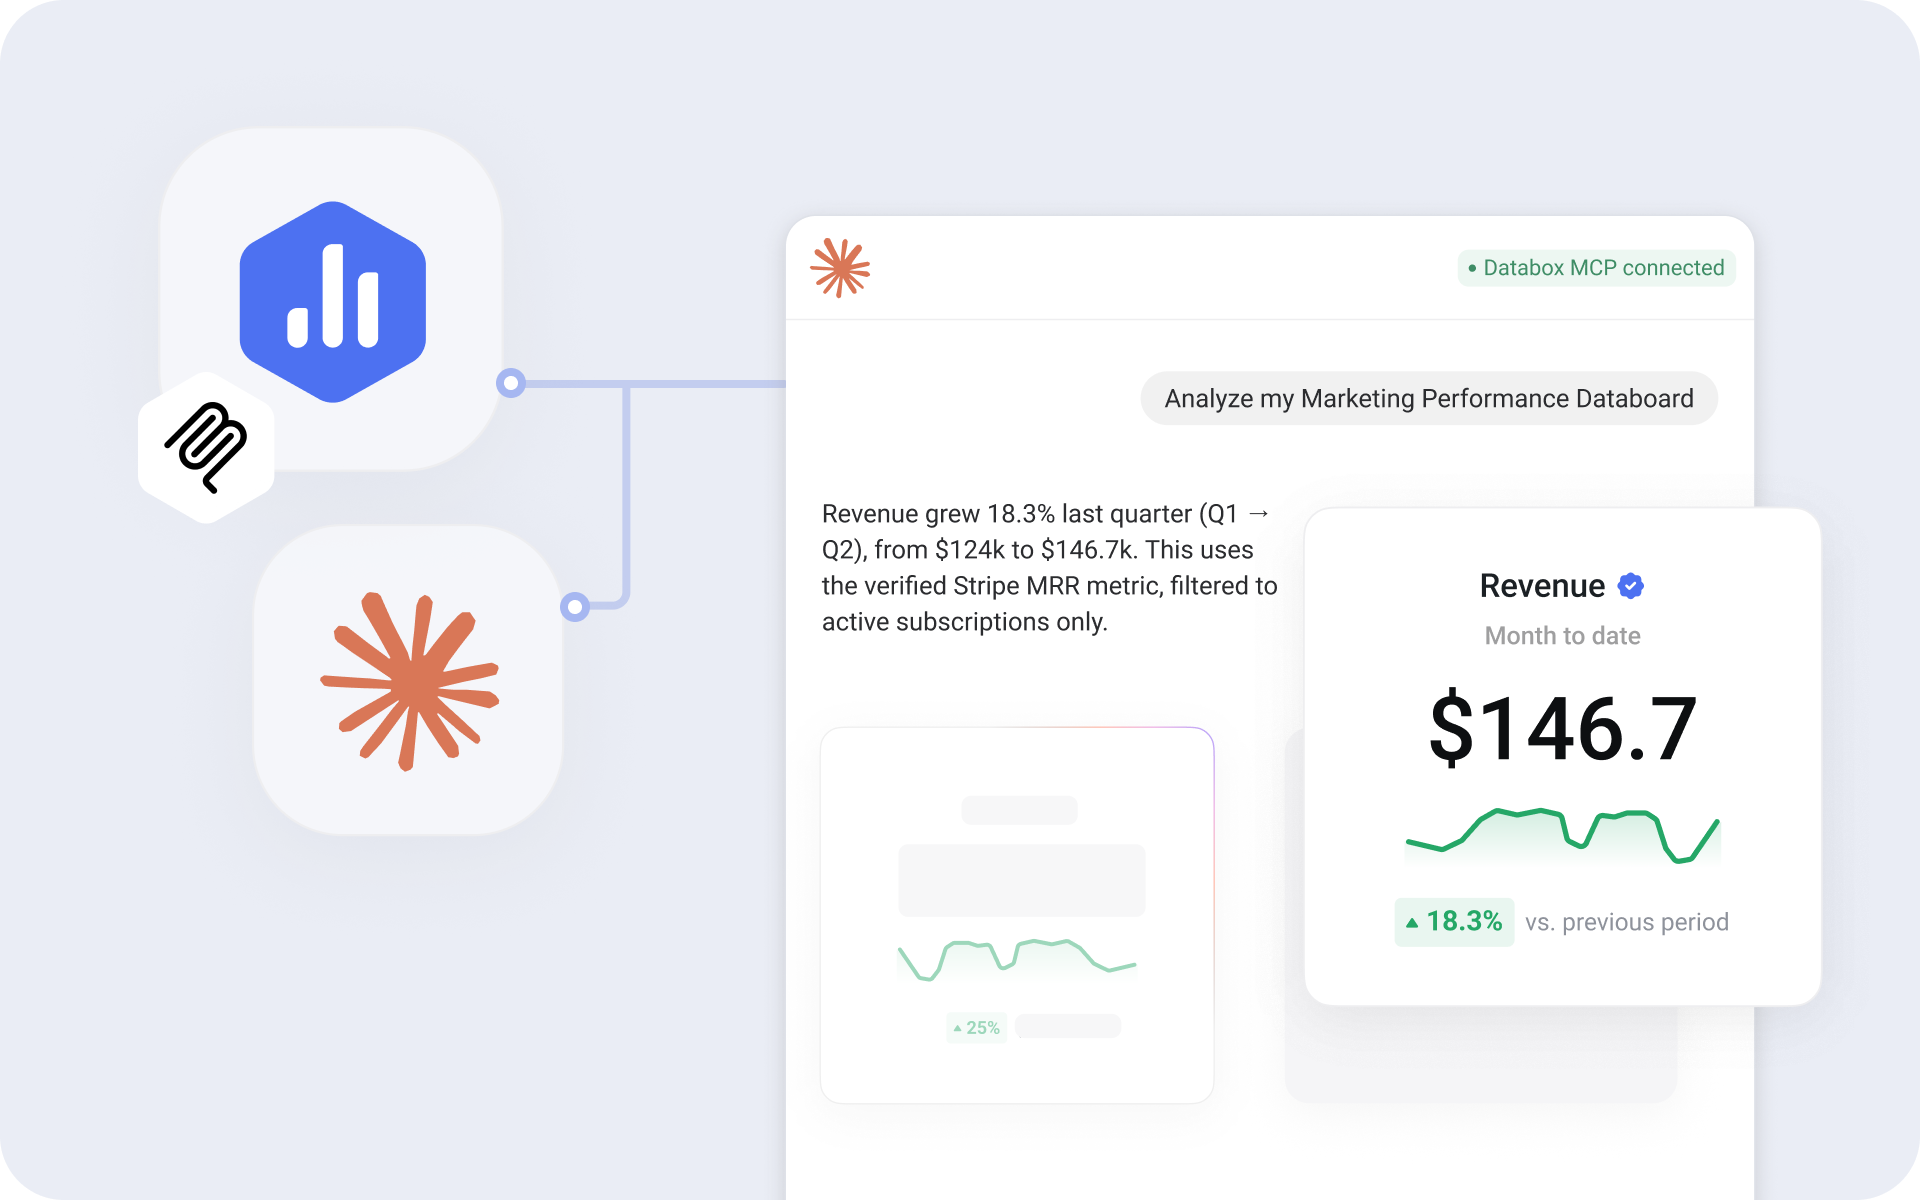
Now, when you use Databox MCP with Claude, you'll see interactive charts right inside your conversation and can analyze any of your Databoards just by asking about it.
For example, ask about your revenue and the chart appears right next to the answer, so you can see the trend, explore patterns, and ask the next right question. Or ask Claude to analyze your "Marketing Performance" Databoard, and it pulls the right metrics and explains what changed, so you walk away with an answer you can take straight into a client update or a leadership review.
improvement
Manage Data Sources And Users From The Databox App
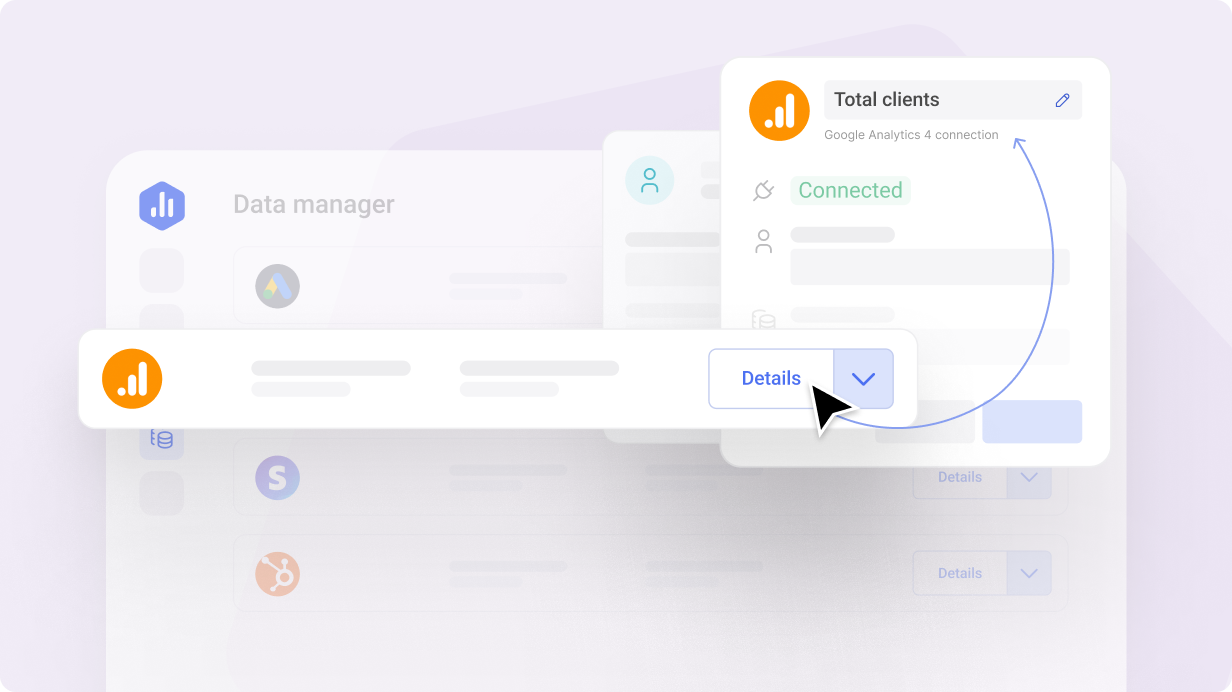
Instead of navigating to the Account Management Application, you can now edit data source and user details directly inside the Databox app.
Click "Details" on a data source or "Edit user" on a teammate to open a pop-up and make your changes, so you get admin work done faster.
data integrations
Close The Gap In Your Reporting Stack With Custom Integrations

Connect almost any API to Databox and turn the response into a structured dataset, no code required.
- Get the complete picture: Bring in data from internal systems, niche platforms, and custom-built tools so your reports reflect everything your team relies on.
- Replace the workarounds you've been maintaining: Swap manual exports, one-off scripts, and fragile automations for a connection that syncs on its own.
- Make custom data accessible to the whole team: Anyone on your team can ask questions about the data through Genie or in your favorite AI tools.
improvement
Configure Your Charts To Match The Metric
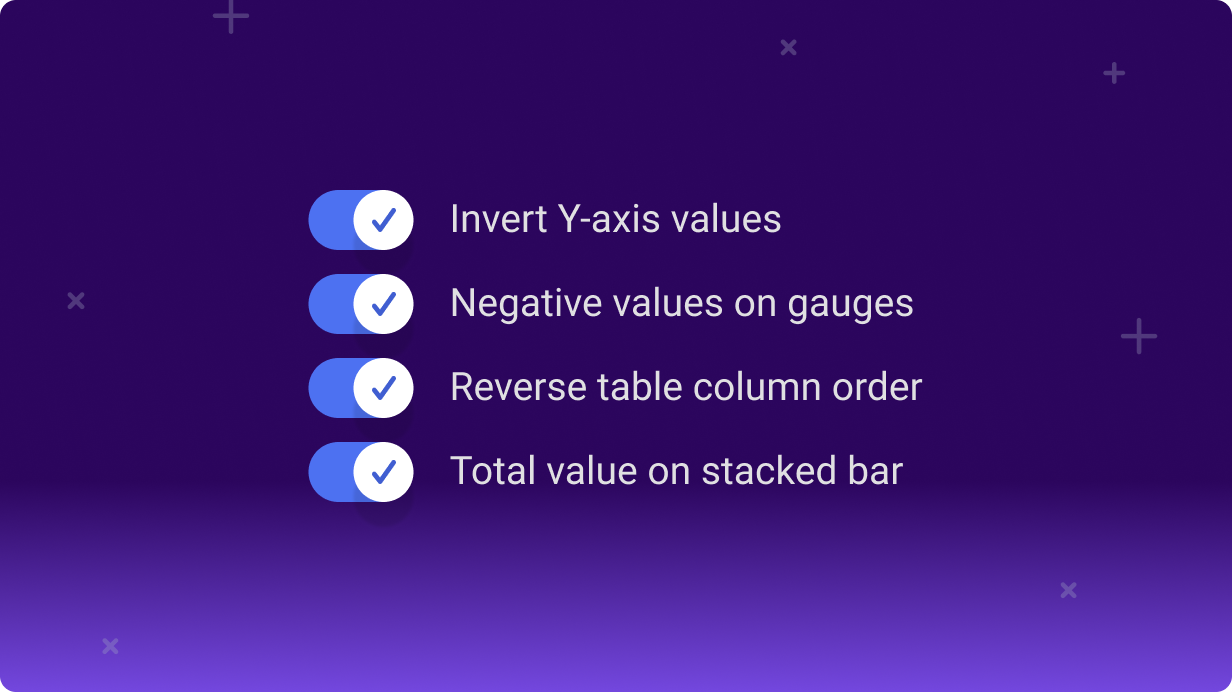
We've added four new chart settings to give you more control over how your data is presented, so every chart on your Databoard communicates insights clearly.
- Show the best result at the top of your chart: Invert the Y-axis on line and bar charts so metrics like search rankings read the way your team expects.
- Track scores that span negative ranges: Set negative starting values on gauges to visualize metrics like Customer Satisfaction Score across the full -100 to +100.
- Put the most recent period first: Reverse the column order on tables with column granularity, so your team sees what's current without scrolling.
- Show the per-period total at a glance: Display total values on top of stacked bar charts, so the combined value of all dimensions reads without anyone doing the math.
new
Meet Genie, your AI Analyst
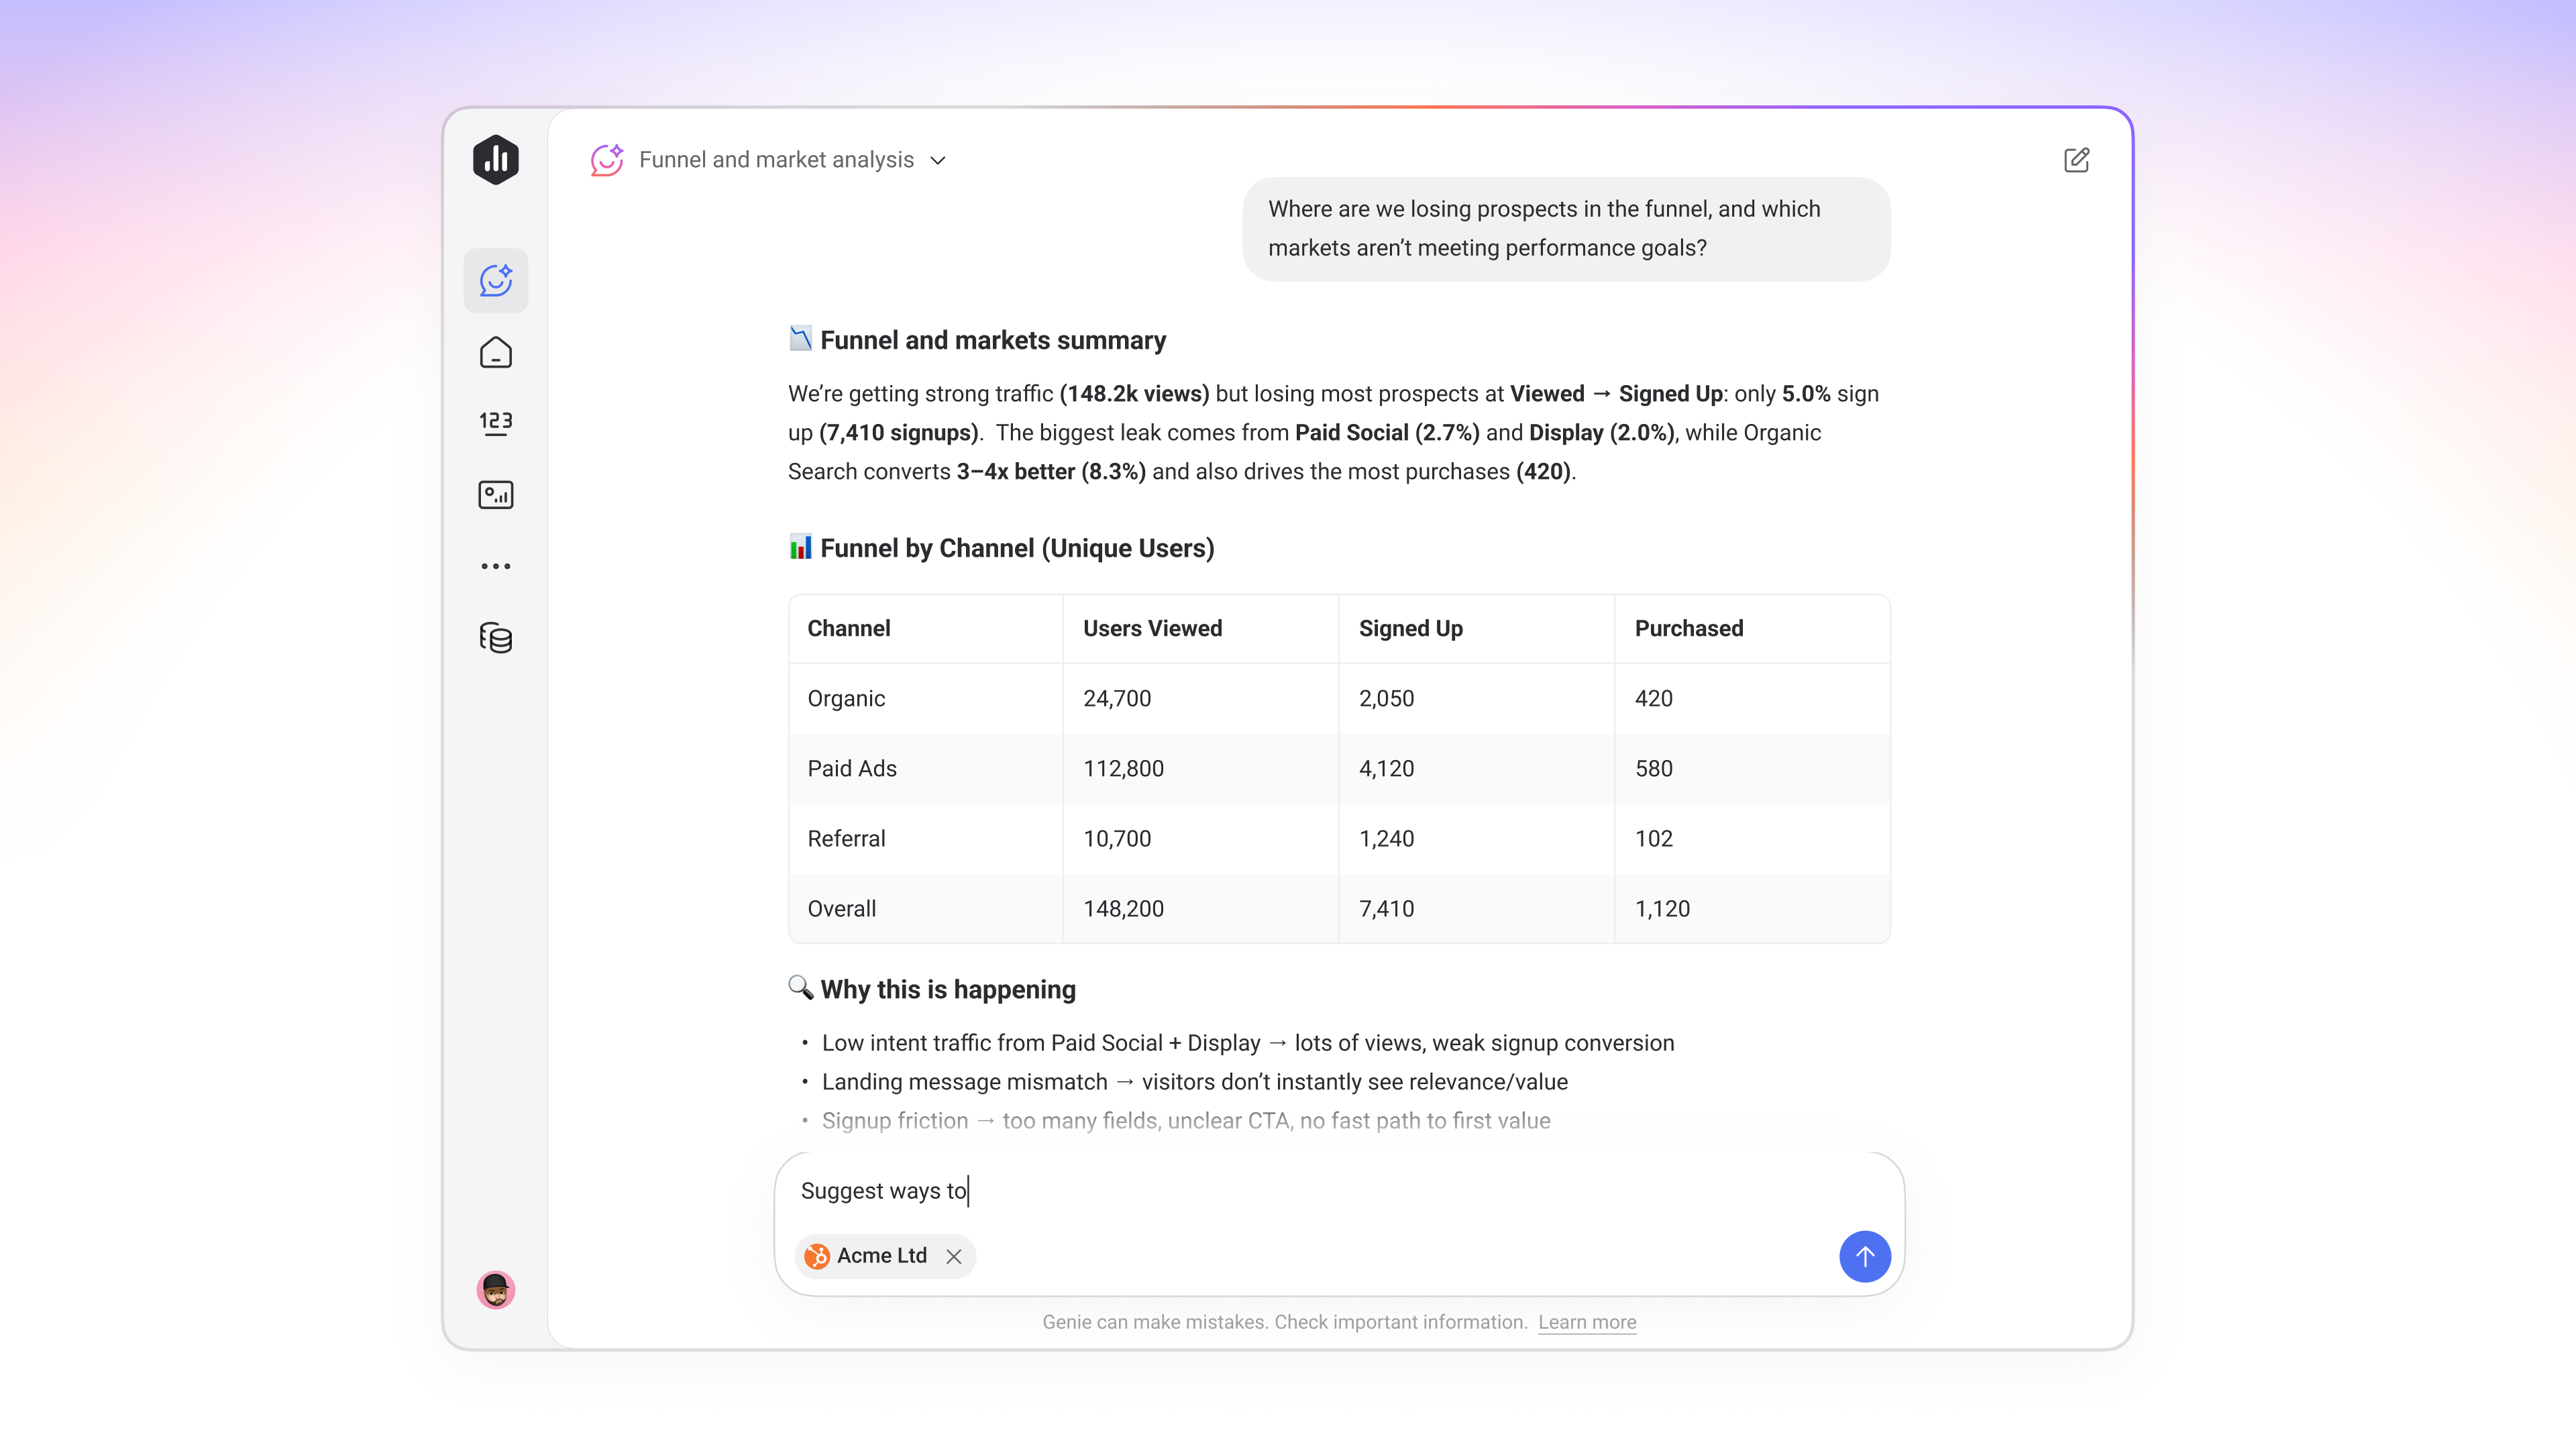
Ask questions about performance in plain language and get clear, contextual answers in seconds
- Get answers from your data, instantly: Ask any question and get answers with charts and context pulled from your actual metrics.
- Build metrics and Databoards by describing what you want: Tell Genie what you want to track or visualize, and it builds it.
- Share insights with anyone: Send a link to any Genie conversation with teammates or external stakeholders
- And more!