Join over 20,000+ Businesses using Databox
Easy No-Code Dashboard & Reporting Sofware Built for Agencies
Track and Report all your clients’ Analytics, Social Media, SEO tools, and CRM data in All-in-One Tool. No need to switch tabs and get lost in different tools!
- Beautifully prebuilt or custom dashboards
- Over 100+ native integrations
- One click report templates
- Data-informed decisions made easy
- Setting goals with Mobile APP notifications
- Analyze your client’s data quickly and efficiently


- No Credit Card
- Unlimited users on all plans
- AWS Security Protocols
20,000+ scaling teams & agencies drive results that matter


Analytics Tool Made for Agencies Of All Sizes
Track All Your Clients From One Place
- Say goodbye to scattered data and hello to a unified view of all your clients’ performance metrics. Databox brings everything under one roof, making it easier to manage and scale your agency’s services efficiently.
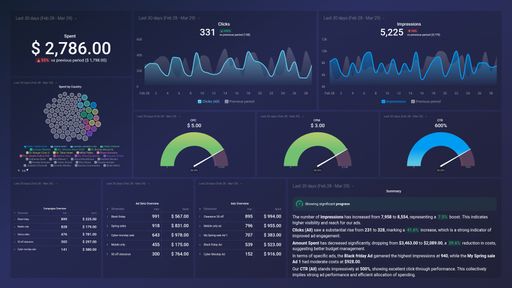
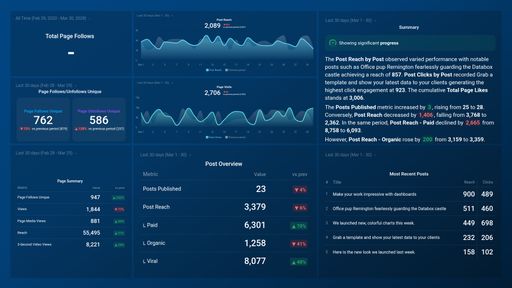
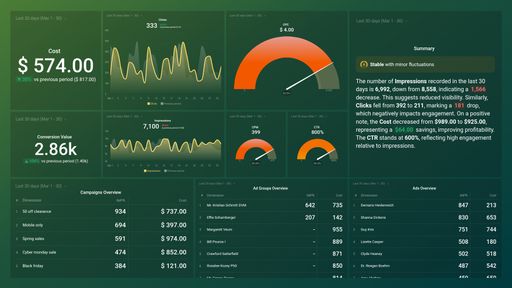
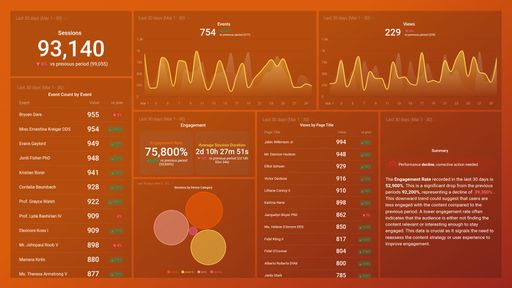
Create Custom Dashboards in Minutes
- Effortlessly build and share stunning dashboards that bring ads to sales metrics into focus. Provide insights that explain performance trends, and give clients constant access to their data, enhancing transparency and trust.
Automate Client Reporting, Save Hours
- Ditch manual report preparation and automate it by scheduling updates directly to email or Slack, complete with the latest dashboards, images, and text. Plus, receive reminders to review everything before it goes out, ensuring your reports are always accurate and up-to-date.
Most Popular Integrations at Your Fingertips


And if you need important metrics from a different data source, no worries. You can connect powerful software integrations, APIs, Databases and custom Spreadsheets.
Empowering Executives, Automating for Account Managers, Inspiring Creatives
Account Manager
- Centralize Management:
Create, delete, or update all client accounts in one place. - Automate Reports:
Enhance client communication with custom, automated reports. - Simplify Collaboration:
Easy team access with shared client setups.
Account Executive
- Custom Dashboards:
Integrate data for tailored client views with Databox. - Benchmarking:
Assess client standings and competitive edge. - Streamline Report Sharing:
Instantly send reports via email or Slack.
Marketing Manager
- Integrated Insights:
Merge various data sources for complete marketing insights with Databox. - ROl Analysis:
Use custom metrics and forecasting to assess marketing ROl. - Custom Databoards:
Create detailed Databoards from the ground up for comprehensive overviews.
Digital / Social / Content / Paid Media Manager
- Campaign Analysis:
Dive into campaign data for specific performance metrics with Databox. - Benchmarking:
Track and compare actionable insights for optimizing campaign performance and ROl. - Template Utilization:
Speed up Databoard setups and reporting with pre-designed templates.

Learn How Growing Companies Like Yours Are Using Databox
First Response Boosts Sales by 55% Year-Over-Year with Databox
- Found a unified solution to integrate sales, marketing, and financial data from diverse sources.
- Developed customized dashboards to uncover comprehensive performance insights across the company.
- Improved decision-making and strategic planning by providing real-time access to crucial data.
- Grew a culture of accountability and collaboration by making data easily accessible and understandable for all team members.
MarketLauncher Elevates Goal Achievement by 20% with Databox
- Implemented Databox to integrate HubSpot data, consolidating client and sales rep performance metrics in one accessible location.
- Developed personalized dashboards for each sales rep, showcasing client-specific goals, tasks, and overall performance.
- Created a high-level management dashboard, enabling immediate identification of performance gaps and actionable insights for each team member.
- Shared dashboards through links, ensuring all team members have real-time visibility into their performance and objectives.
Start Instantly with Pre-Built Marketing Dashboards
“At Databox, we’re obsessed with helping agencies more easily monitor, analyze, and report client results. Whether it’s the resources we put into building and maintaining integrations with 100+ popular marketing tools, enabling customizability of charts, dashboards, and reports, or building functionality to make analysis, benchmarking, and forecasting easier, we’re constantly trying to find ways to help our agency customers save time and deliver better results.”

-
CEO at Databox and creator of HubSpot’s partner program, pioneering the agency growth model
-
Helped hundreds of agencies and their clients achieve measurable ROI
-
Key player in scaling HubSpot’s channel sales to over $100M ARR
Save Time, Build Trust, and Showcase Your Value with Databox
Instant Performance Insights
Increase client engagement by 60% with DataboxShare performance data instantly via user-friendly dashboards, providing clear, impactful insights for simpler customer comprehension.
Automated Reports & On-Demand Access
Agencies using our platform report a 70% reduction in data compilation and reporting time. Leverage our comprehensive analytics for a decisive competitive edge.Comprehensive Marketing Analysis
Enhance strategies with a 30% uptick in campaign performance by integrating multi-channel data. Empower clients with foresight into future results through precise forecasting, showcasing your dedication to growth.Innovative Value-Added Services
Boost revenue by 25% with AI insights, benchmarks, and forecasting. Elevate your agency's value and exceed client expectations with our comprehensive, data-driven tools.Simple to start, built to scale
-
Data updated hourly This is the default sync interval for your data sources. You can adjust it per data source later if needed.
-
10Dashboards (across all accounts) Track the metrics that matter with fully customizable dashboards. Multiple visualization types, drag-and-drop layout.
-
5Client accounts Set up dedicated client accounts to streamline and organize your reporting process.
-
∞Unlimited users Invite as many team members as you need and set different permission levels to control what they can see and do.
-
∞Unlimited custom metrics Create custom metrics by adding calculations, filters, segments, and dimensions to your data.
-
Scheduling and sharing Schedule recurring snapshots of dashboards and reports, and share them with secure links.
-
Bulk operations Select multiple items and perform actions on them at once.
-
Client performance overview View every client’s top metrics and goals in one screen.
-
130+ cloud services (incl. marketing, e-comm, CRM)
- 3 Data Sources included
- Unlimited Data Sources limit
- Connect 130+ cloud integrations
- Connect data via Zapier/Make
- Connect data via API
- 24 months Historical data
- 5GB Warehouse data storage
- unlimited Create custom metrics
- Connect to AI tools (MCP server)
- 10 Build custom dashboards
- Looped dashboards
- Use pre-built dashboard templates
- Custom account templates
- Add-on Fiscal calendars
- Stream dashboards to TV
- Embed & share dashboards
- Shareable links
- Scheduled snapshots
- Scorecards
- Weekly metric digest
- Chart annotations
- Send updates to Slack
- Alerts
- Add-on OKRs
- unlimited Add users
- unlimited Create Spaces
- User permissions
- Single sign-on (SSO)
- Add-on Advanced Security Management
- Starter onboarding
- Add-on Priority support
- Add-on Dedicated reporting specialist (2h/mo)
- Add-on Custom metrics & dashboard creation
- 5 Create client accounts
- Client performance & goals overview
- Custom account templates
- Push template changes to dashboards or reports
- Become a Solutions Partner
- Bulk actions
- Add-on View email activity
- Add-on White label
-
 AI Analyst New Ask questions about your performance in plain language and get instant answers.
 -
∞Unlimited dashboards Create as many dashboards as you need to track different teams, tools, or clients.
-
∞Unlimited client accounts Set up dedicated client accounts to streamline and organize your reporting process.
-
Reports Stay on top of your company or team’s performance with automated reports.
-
Goals Set goals for your team or company and track progress in real time.
-
Media creatives Display your ad creatives alongside related ads data.
-
Remove branding from dashboards Remove “Powered by Databox” and the Databox logo from reports in your account.
-
Professional onboarding Go live faster with aligned metrics, clear goals, and a repeatable performance review cadence.
-
Spreadsheets (Excel) and Custom Integrations
- 3 Data Sources included
- Unlimited Data Sources limit
- Connect 130+ cloud integrations
- Connect data via Zapier/Make
- Connect data via API
- Connect spreadsheet data
- 24 months Historical data
- 20GB Warehouse data storage
- unlimited Create custom metrics
- Connect to AI tools (MCP server)
- AI analyst
- unlimited Build custom dashboards
- Looped dashboards
- Use pre-built dashboard templates
- Custom account templates
- View media creatives
- Refresh data on-demand
- Single-dimension filtering
- Add-on Fiscal calendars
- Create automated reports
- Presentation mode
- Use pre-built report templates
- Custom report templates
- Archived Reports
- Remove branding
- Get performance notifications
- Stream dashboards to TV
- Embed & share dashboards
- Shareable links
- Scheduled snapshots
- Scorecards
- Weekly metric digest
- Chart annotations
- Send updates to Slack
- Alerts
- Create custom goals
- Add-on OKRs
- unlimited Add users
- unlimited Create Spaces
- User permissions
- Single sign-on (SSO)
- Add-on Advanced Security Management
- Professional onboarding
- Add-on Priority support
- Add-on Dedicated reporting specialist (2h/mo)
- Add-on Custom metrics & dashboard creation
- unlimited Create client accounts
- Client performance & goals overview
- Custom account templates
- Push template changes to dashboards or reports
- Become a Solutions Partner
- Bulk actions
- Add-on View email activity
- Add-on White label
-
AI Analyst New Ask questions about your performance in plain language and get instant answers.
-
AI perf. summaries & Data stories Get AI-generated summaries that explain performance trends and suggest what to do next.
-
Metric anomalies & Smart alerts Get notified when unusual patterns (like unexpected spikes or dips) are detected in your data.
-
Datasets New Prepare custom tables of raw data from one or more sources. Apply filters and calculate new columns to analyze and visualize your data however you need.
-
Raw data export & drilldown New See the raw data behind any metric, export it or drill down for details.
-
Data prep (merge, filter, calculate) Blend data from multiple sources, filter by dimension, and create custom calculated metrics.
-
Forecast modeling Forecast the future performance of any metric for the next month, quarter, or year. Model changes to explore scenarios and turn projections into goals with one click.
-
Growth onboarding Go live faster with aligned metrics, clear goals, and a repeatable performance review cadence.
-
Databases and Cloud warehouses
- 3 Data Sources included
- Unlimited Data Sources limit
- Connect 130+ cloud integrations
- Connect data via Zapier/Make
- Connect data via API
- Connect spreadsheet data
- Connect databases and warehouses
- Integrations with dataset support
- unlimited Historical data
- 20GB Warehouse data storage
- unlimited Create custom metrics
- Create datasets
- Merge datasets
- Connect to AI tools (MCP server)
- AI analyst
- AI performance summaries
- unlimited Build custom dashboards
- Looped dashboards
- Use pre-built dashboard templates
- Custom account templates
- View media creatives
- Refresh data on-demand
- Single-dimension filtering
- Add-on Fiscal calendars
- Drill down to row-level data
- View anomalies
- Export to CSV
- Create automated reports
- Presentation mode
- Use pre-built report templates
- Custom report templates
- Archived Reports
- Remove branding
- Get performance notifications
- Add Data Stories
- Stream dashboards to TV
- Embed & share dashboards
- Shareable links
- Scheduled snapshots
- Scorecards
- Weekly metric digest
- Chart annotations
- Send updates to Slack
- Alerts
- Smart Alerts
- Create custom goals
- Forecasting & Modeling
- Add-on OKRs
- unlimited Add users
- unlimited Create Spaces
- User permissions
- Single sign-on (SSO)
- Add-on Advanced Security Management
- Growth onboarding
- Add-on Priority support
- Add-on Dedicated reporting specialist (2h/mo)
- Add-on Custom metrics & dashboard creation
- unlimited Create client accounts
- Client performance & goals overview
- Custom account templates
- Push template changes to dashboards or reports
- Become a Solutions Partner
- Bulk actions
- Add-on View email activity
- Add-on White label
-
AI Analyst New Ask questions about your performance in plain language and get instant answers.
-
White-labeling ($200 value) White label Databox to offer clients your own custom branded reporting solution.
-
OKRs ($160 value) New Track company-wide and nested goals and align every team’s efforts toward measurable outcomes, all in one place.
-
Advanced security ($80 value) Meet internal security standards with advanced security settings like Force SSO, Force 2FA, Activity Log, Login Records, and more.
-
15-min sync ($72 value) Choose 5 data sources to sync every 15 minutes and keep your most important data up to date.
-
Fiscal calendar ($40 value) Select a fiscal calendar as your date range to monitor performance based on your financial year.
-
Reporting specialist ($160 value) Meet with a Databox expert twice a month who provides ongoing dashboard reviews, key insights, and continuous reporting improvements as your business evolves.
-
Priority support ($80 value) Get faster responses by moving your cases to the top of our chat and email support queue.
-
Premium onboarding Go live faster with aligned metrics, clear goals, and a repeatable performance review cadence.
- 50 Data Sources included
- Unlimited Data Sources limit
- Connect 130+ cloud integrations
- Connect data via Zapier/Make
- Connect data via API
- Connect spreadsheet data
- Connect databases and warehouses
- Integrations with dataset support
- unlimited Historical data
- unlimited Warehouse data storage
- unlimited Create custom metrics
- Create datasets
- Merge datasets
- Connect to AI tools (MCP server)
- AI analyst
- AI performance summaries
- unlimited Build custom dashboards
- Looped dashboards
- Use pre-built dashboard templates
- Custom account templates
- View media creatives
- Refresh data on-demand
- Single-dimension filtering
- Fiscal calendars
- Drill down to row-level data
- View anomalies
- Export to CSV
- Create automated reports
- Presentation mode
- Use pre-built report templates
- Custom report templates
- Archived Reports
- Remove branding
- Get performance notifications
- Add Data Stories
- Stream dashboards to TV
- Embed & share dashboards
- Shareable links
- Scheduled snapshots
- Scorecards
- Weekly metric digest
- Chart annotations
- Send updates to Slack
- Alerts
- Smart Alerts
- Create custom goals
- Forecasting & Modeling
- OKRs
- unlimited Add users
- unlimited Create Spaces
- User permissions
- Single sign-on (SSO)
- Advanced Security Management
- Premium onboarding
- Priority support
- Dedicated reporting specialist (2h/mo)
- Add-on Custom metrics & dashboard creation
- unlimited Create client accounts
- Client performance & goals overview
- Custom account templates
- Push template changes to dashboards or reports
- Become a Solutions Partner
- Bulk actions
- View email activity
- Add-on White label
All Databox software and customer data are securely housed within Amazon AWS infrastructure, ensuring compliance with AWS security certifications and GDPR standards.

Clear answers,
as fast as you have questions.
Compare
Databox Inc.
HQ: Boston, MA, USA
AI-powered analytics for teams that need answers now.
Databox Inc.
HQ: Boston, MA, USA

AI-powered analytics for teams that need answers now.


Compare