Table of contents
The shift isn’t faster reports — it’s a wider question-asking surface.
TL;DR
- Using AI in data analytics means adding a layer of capability: natural language querying, automated analysis, generative AI, on top of your existing analytics workflow that does work specialists used to do.
- The shift changes who can use your data, not just how fast they get answers. AI removes the access gate AND the interpretation layer that previously confined data work to specialists.
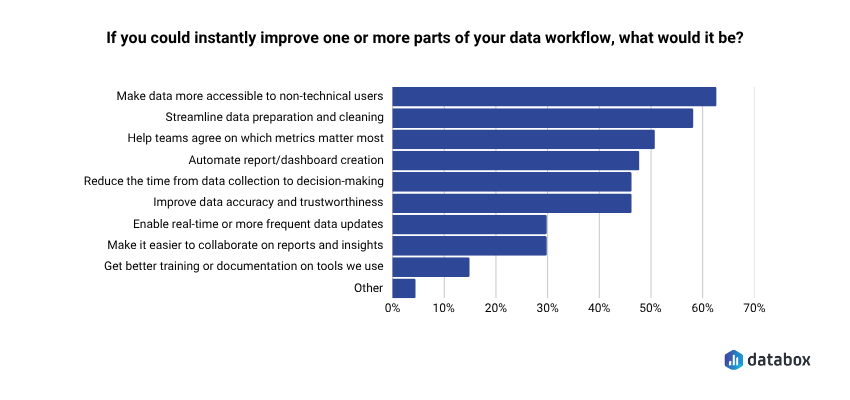
- 62% of teams say making data more accessible to non-technical users is the workflow change they’d most want to make. AI is the first technology that delivers it without sacrificing accuracy.
- Six capabilities make the shift real: natural language querying, AI-generated performance summaries, automated data cleaning, anomaly detection, prescriptive analytics, and agentic AI workflows.
- AI works only on top of clean, connected, consistently defined data. Skip the foundation and you scale your inconsistency across the company.
Introduction
How many people on your team can get a real answer to a question about the business numbers without filing a ticket, opening a help doc, or finding the right analyst? For most companies the honest answer is: a small handful. Everyone else either guesses, waits, or stops asking.
In Databox’s Time to Insight research, 62% of teams say making data more accessible to non-technical users is the workflow change they’d most want to make. The demand is universal. The capability isn’t: most business data still lives behind a layer of access, technical expertise, and interpretation that only data teams have.
AI in data analytics changes that. Not by handing more people a dashboard, but by removing the two things dashboards never solved: the access gatekeeping and the interpretation layer. A marketing manager asks “why is our CPL up this month?” in plain English and gets a plain-English answer tied to the actual data. The question “who’s allowed to ask the data a question?” has a new answer: anyone with a question.
This article covers what using AI in data analytics actually means, the six capabilities that make the shift real, and what has to be true about your data before any of it works.
What “Using AI in Data Analytics” Actually Means
Using AI in data analytics means layering capabilities like machine learning, natural language processing, and generative AI onto your existing workflow to do work that used to require specialists.
Traditional business intelligence tells you what happened. You open a dashboard, apply filters, interpret the chart, and translate the numbers into a recommendation. Each step required expertise: knowing which report to open, knowing which slice mattered, knowing how to read a trend in context.
AI in data analytics adds three capabilities on top of that workflow. It explains why a metric moved, in plain language. It predicts what’s likely to happen next based on historical patterns and live signals. And it surfaces things you didn’t know to look for — anomalies, patterns, correlations that would have taken hours of analyst-led exploration to find. The interpretation step that previously required a specialist now happens inside the tool, which means the specialist is no longer the gatekeeper.
The AI analytics market reflects where investment is heading: from $29.1 billion in 2024 to $223.3 billion by 2034 at a 22.6% compound annual growth rate. But the more useful question isn’t market size. It’s which of those capabilities your team actually has access to today, and which roles in your company are still locked out of using them.
The Real Bottleneck Isn’t Speed — It’s Who’s Allowed to Ask
AI in data analytics has been positioned as a productivity tool for data teams; a way for analysts to work faster and ship more reports. That framing misses the bigger shift. The cost of analyst-gated analytics isn’t slow analyst output. It’s that most of the company never asks the question in the first place.
Databox’s research surfaces the gap directly. 62% of teams say they want data more accessible to non-technical users — the most common workflow improvement named in the entire survey. In the research we did on data transparency, majority of leaders say data transparency clearly improves business performance and positively impacts team alignment and collaboration. Still, about 60% report that all employees actually have access to most or all key metrics. The value of broad access is well-established. The access itself isn’t.
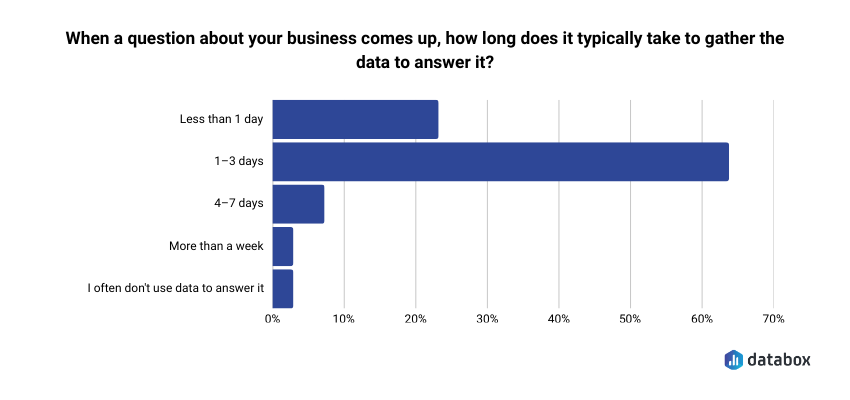
Even when leaders do submit questions to the data team, the wait is real: 64% of teams say it takes 1–3 days to gather the data needed to answer a single business question. By the time the answer arrives, the meeting has moved on, the budget has been allocated, and the campaign has been running unchanged for three days. But the speed problem is downstream of the bigger one: the person who needed the answer didn’t have a way to get it themselves.
AI doesn’t make analysts redundant. It removes the gate. When a regional manager, an account executive, or a campaign lead can ask a question in plain English and get a trustworthy answer, the analyst’s role shifts from data-pulling to strategic interpretation. The role becomes more valuable, not less, because the low-leverage work moves to the AI layer.
The company that lets more people ask better questions makes better decisions across more parts of the business. That’s the change AI is making, not just faster reports, but a wider question-asking surface.
6 Ways to Use AI in Data Analytics That Open Your Data to More Roles
Each capability below removes a specific layer that previously kept data confined to specialists: the asking layer, the communication layer, the data-prep layer, the alerting layer, the action layer, and the workflow-handoff layer.
1. Natural Language Querying and Conversational Analytics
This is the load-bearing capability. Most functional leaders and operational roles sit one step away from their data. They have access to dashboards, but answering a specific question, like “Why did conversion drop last week?”, still means knowing which report to open, which filters to apply, and which analyst to ask if the answer isn’t obvious.
Natural language querying removes that barrier. You ask a question in plain English. AI analyzes the underlying data, identifies relevant patterns, and explains what’s happening in language a non-technical user can act on.
A COO asks “what’s driving the increase in customer acquisition cost this month?” and gets an explanation that identifies paid search CPCs rising alongside a drop in landing page conversion — in under 30 seconds. A regional manager asks “why is my market underperforming?” and gets a breakdown by channel and segment without without filing a ticket and waiting for two days.
Databox Genie works this way against your live, connected business metrics. A VP of Marketing asks “why did conversion drop last week?” and Genie pulls the relevant data, identifies the patterns, and returns a plain-language explanation tied to the actual metrics the team tracks — not a demo dataset.
The answer to “what’s going on with our numbers?” is no longer a two-day request submitted by a leader. It’s a sentence away, for anyone with a question.
2. AI-Generated Performance Summaries
Weekly leadership reporting is high-effort work with low analytical yield. In Databox’s State of Business Reporting, a third of teams produce 5–10 different reports per month, and roughly a quarter spend 3–5 hours every month just creating them. Someone reads four dashboards, synthesizes the trends, writes a summary, and distributes it. The summary is ready by Thursday. The meeting was Wednesday.
AI reads the data and writes the summary. No dashboard opened. No analyst prompted. Beyond saving time, AI summaries make data-driven communication possible for roles that previously couldn’t do it, so a regional team lead can send a weekly performance summary to their manager without learning a BI tool, an account executive can brief a client on their numbers without an analyst’s help.
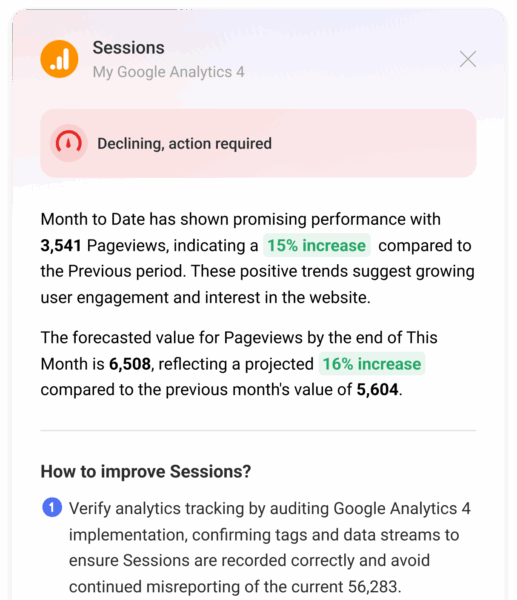
A typical AI-generated weekly summary reads like: “Paid acquisition spend increased 12% week over week. Lead volume held flat, driving CPL up $8.40. Primary driver: search CPCs rose in Campaign A and Campaign B.” That’s the brief your team used to spend two hours writing. It writes itself, and arrives before the meeting, not after.
The AI still handles natural language understanding, question interpretation, and conversational follow-up. But it never does the math. Calculation happens in the governed layer where metric definitions are locked, data connections stay current, and the audit trail stays intact.
3. Automated Data Cleaning and Preparation
Before analysis happens, data has to be consistent. Field names need to match across systems. Duplicates need to be merged. Missing values need to be flagged or filled. The Time to Insight research found that 59% of teams want to streamline data preparation and cleaning — it’s the second-most-named workflow improvement, behind only making data more accessible.
This used to be a job only data engineers and analysts could do. AI handles it now: detecting duplicates, normalizing date formats, flagging incomplete records, reconciling mismatched field names across systems. None of it requires anyone to touch a SQL query, and none of it sits between a leader and a clean report.
The democratization point matters here. When data prep is the gate between a question and an answer, only the people who can do data prep get to ask questions. When AI handles it, the gate is gone, and any role can trust that the report they’re looking at reflects clean, reconciled data, even when that data spans CRM, marketing automation, and finance.
4. Anomaly Detection
By the time anyone notices an anomaly during a weekly review, the damage has compounded for days. A conversion rate that dropped Tuesday gets surfaced in Friday’s report, after three days of underperforming campaigns continued to run. The detection layer used to require an analyst running queries; everyone else found out in the report.
AI flags deviations instantly: it learns what “normal” looks like for each metric and alerts when something breaks the pattern to whoever owns that metric, not just the data team.
Previously, the analyst noticed and forwarded. Now the alert lands directly with the marketing director whose open rate dropped, the e-commerce manager whose cart abandonment spiked, the support lead whose ticket volume jumped, in time for them to act, not after the fact.
5. Prescriptive Analytics and Decision Recommendations
Predictive analytics tells you what’s likely to happen. Prescriptive analytics goes one step further: it tells you what to do about it, ranking actions by expected impact.
The gap this closes is significant, and most acutely felt by non-specialists. Knowing there’s a pipeline shortfall is useful, but only actionable for someone who knows what to do about it. Knowing which three actions have the highest probability of closing the gap is actionable for anyone with the authority to take them.
A Revenue Operations director sees a predictive model flag a pipeline shortfall for next quarter. A prescriptive layer surfaces three ranked recommendations: accelerate two high-probability deals by advancing their next steps, re-engage a segment of stalled opportunities with a specific offer, and adjust lead routing rules. A line manager sees the same recommendations and can act on the ones in their scope, without an analyst translating the model output for them.
6. Agentic AI and Automated Workflows
Even teams with strong AI analytics tools still rely on humans to bridge steps. An alert fires. Someone reads it. Someone pulls the relevant data. Someone writes a summary. Someone messages the stakeholder. Each handoff adds latency and depends on someone being available, usually someone in a specialist role.
Agentic AI compresses those handoffs. Rather than answering a single question and waiting for the next instruction, it takes sequences of actions autonomously: pulling the data, running the analysis, generating the summary, triggering the workflow response. The chain of “someone has to do the next step” becomes a single end-to-end execution that lands in the inbox of whoever owns the metric.
Agentic AI is still emerging, but the direction is clear: the number of human handoffs in the analytics-to-action chain is shrinking, which means more of the company can act on data without specialist intermediaries.
Databox’s MCP connects your Databox data to external AI tools like Claude, ChatGPT, and n8n, so teams can build automated workflows that query their metrics, generate explanations, and take action from inside the AI tool they already use.
What Has to Be True Before This Works
AI analytics is only as trustworthy as the data underneath it. Most articles explain what AI can do. Few ask whether your data is in shape for AI to do it well. The risk isn’t that AI fails, it’s that AI succeeds at producing fluent answers that aren’t true, and pushes those wrong answers across more roles, faster.
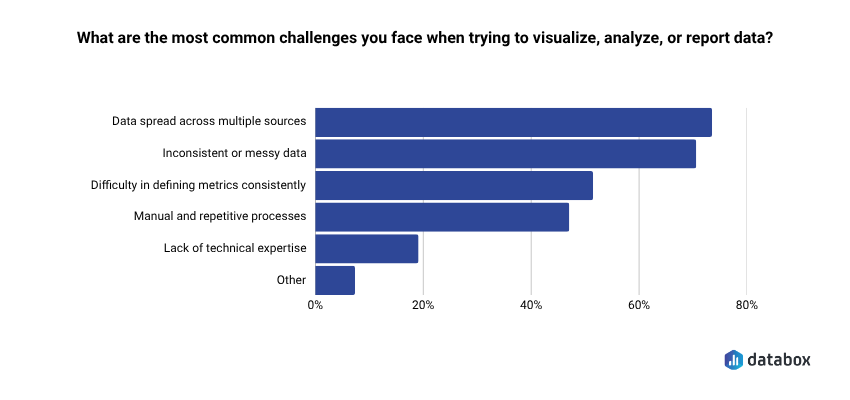
The foundation problem is widespread. In Databox’s Time to Insight research, 73% of teams say data spread across multiple sources is their top reporting challenge, and 72% cite inconsistent or messy data as a recurring blocker. 48% say a single standardized definition for core metrics is the change that would most improve trustworthiness — more than any other intervention tested.
Four questions to run before evaluating tools:
Is your data centralized? Are the metrics you track coming from one connected source, or scattered across spreadsheets, standalone tools, and manual exports? AI can’t connect what isn’t connected.
Are your metrics standardized? Does “conversion rate” mean the same thing in Marketing as it does in Sales? If the same metric has multiple definitions, AI will produce multiple conflicting answers — and giving more people access to that inconsistency means more people acting on more conflicting numbers.
Can non-specialists currently get basic answers on their own? If getting a simple metric requires filing a request, the access problem exists before the AI problem. Layering AI on a broken access model automates the bottleneck rather than removing it.
Is the AI grounded in your real data? Generative AI without access to your live, computed metrics will confidently produce fluent answers that aren’t true. The AI layer should sit on top of a computation engine that calculates the actual numbers, with the LLM only interpreting what the engine produces. If you ask a generic AI tool “why did our pipeline drop?” with a CSV attached, you’re getting a plausible guess, not a real answer.
Many teams are closer to AI-ready than they think. The questions aren’t meant to discourage adoption, they’re meant to sequence it correctly. Close the foundation gaps first and AI becomes an asset across the whole company. Skip them and AI scales your inconsistency.
How to Start Using AI in Data Analytics
The strongest teams don’t start by shopping for an AI tool. They start by building the foundation that makes the AI tool trustworthy for everyone who will now use it. Four steps:
Centralize your data sources. Connect your core business tools: CRM, marketing automation, ad platforms, finance, support into a single analytics layer. For most teams, this isn’t a data engineering project. It’s a matter of connecting tools you already use through native integrations.
Standardize your key metrics. Agree on definitions for your 10–15 most important KPIs before turning on any AI features. What counts as a qualified lead? What’s your churn calculation? Standardization turns AI from a liability into an asset, and once data is accessible across the company, the consistency of those definitions matters more, not less.
Introduce the AI layer on top of clean, connected data. Start with the capabilities that deliver immediate cross-role value: natural language querying and performance summaries. Get your team comfortable asking questions and acting on AI-generated answers before expanding to predictive or prescriptive models.
Introduce the AI layer on top of clean, connected data. Start with the capabilities that deliver immediate cross-role value: natural language querying and performance summaries. Get your team comfortable asking questions and acting on AI-generated answers before expanding to predictive or prescriptive models.
Databox brings these three steps into one platform. Teams connect their sources through 130+ native integrations, define metrics once in the Metric Library, and immediately use Genie to ask questions in plain English against their real, standardized data. A VP of Marketing who connects HubSpot and Google Ads asks “why did CPL increase this month?” and gets a specific, data-grounded answer. A regional team lead, an account manager, or a campaign owner can do the same thing with their own questions.
That’s what data accessibility actually looks like in practice — not just the right to open a dashboard, but the ability to ask, understand, and act on the data behind it.
Frequently Asked Questions
Do I need a data engineer or technical team to use AI in analytics?
No. The core shift AI enables is away from technical prerequisites. Platforms built for non-specialists let you ask plain-language questions against pre-connected data sources without writing SQL or building data models. If your data sources are connected and your metrics are defined, anyone in your company can get AI-generated answers without an engineer in the loop.
What’s the difference between AI analytics and traditional business intelligence?
Traditional BI shows you what happened — dashboards and reports that display historical metrics you interpret yourself. AI analytics adds three capabilities on top: it explains why something happened, predicts what’s likely to happen next, and surfaces anomalies you didn’t know to look for. BI is a mirror you have to know how to read. AI analytics is a mirror that tells you what it sees in language anyone can act on.
Will AI replace data analysts?
No, but it changes what they spend time on. AI handles repetitive, high-volume work: data cleaning, metric monitoring, report generation, plain-language explanation. Analysts shift from data preparation and ad-hoc reporting to metrics quality, strategic interpretation, and ensuring AI-generated answers stay accurate as the business evolves. The role becomes more valuable, not less.
How is using AI in analytics different from just asking ChatGPT about my data?
ChatGPT works on general knowledge or data you upload manually — a snapshot, disconnected from your live systems. AI analytics tools like Databox work on your live, standardized, connected business metrics. The answer is accurate because the data is accurate and computed by a dedicated engine — not because a language model guessed well from a static file.
Where’s the best place to start with AI in data analytics?
Standardize your key metrics first. Then connect your data sources into a single analytics layer. Then introduce AI capabilities, starting with natural language querying and performance summaries — the two that most directly expand who in your company can use the data. Trying to use AI on top of messy, siloed data is the fastest path to confident wrong answers, distributed across more of your team than ever before.